This is a starter walkthrough for distributed tracing. A Rust web app sends spans through an ADOT Collector on ECS Fargate to AWS X-Ray, and the stored traces come back through the AWS CLI and a local Grafana.
Metrics, Logs, and Traces
Observability describes a system whose inner workings you can figure out from the outside. Metrics, logs, and traces are the telemetry that makes that possible. Traces are the subject here.
-
Metrics record values such as CPU utilization or response time as a time series. They show overall trends and how things change.
-
Logs record individual events from an application or a system. The content of an error, or the progress of a job, stays on record along with the time it happened.
-
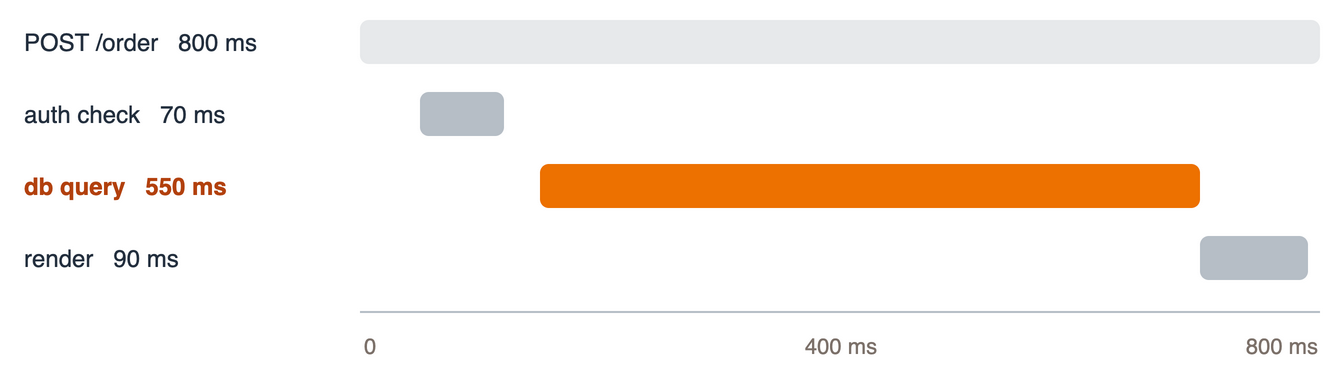
Traces record the path one request took and how long each leg of it lasted. Each leg is a span, and the spans sharing a
trace_idadd up to one trace. Every span carries a start time and a duration, so laying them along a time axis breaks a single request into its parts.
In the diagram below, authentication takes 70 ms, the database query 550 ms, and rendering 90 ms, which is enough to read off where the time went.
What OpenTelemetry Is
OpenTelemetry is an open source project that standardizes and provides the APIs, SDKs, and protocols for producing, collecting, and shipping telemetry such as metrics, logs, and traces, without tying any of it to one monitoring service. It is a graduated CNCF project.
OpenTelemetry calls telemetry of that kind a signal, and the work of making an application emit signals is instrumentation. For traces, that means creating spans inside the application's own code paths so durations and attributes get recorded.
Two approaches to instrumenting Rust application code show up in this walkthrough.
- Manual instrumentation — you write span creation and attributes into the application code yourself. That is the approach here, since the goal is to follow a span from creation to delivery.
- Instrumentation libraries — dropping in a library built for your web framework produces spans and attributes for HTTP requests in a consistent shape. Rust has instrumentation libraries for Actix Web and others.
A span created in the application reaches AWS X-Ray through this chain.
API → SDK → Exporter → Collector → observability backend (AWS X-Ray)
- API — defines the operations an application calls, such as starting and ending a span. In Rust that is the
opentelemetrycrate. - SDK — takes those calls, processes the spans, and holds them until they ship. That is the
opentelemetry_sdkcrate. - Exporter — converts the spans the SDK holds into wire format and sends them to the Collector. Here it is the
opentelemetry-otlpcrate. - Collector — receives telemetry, processes or converts it as needed, and forwards it to a destination.
- Observability backend — stores, searches, and visualizes telemetry. The term means something different from the "backend" of a web application; AWS X-Ray and Datadog are examples, and X-Ray is the destination here.
The API, SDK, and Exporter go into the application as Rust crates. The Collector runs as a separate container.
What AWS X-Ray Is
X-Ray is AWS's managed distributed tracing service. It stores the traces it receives, and offers search and visualization on top of them.
A dedicated X-Ray SDK and the X-Ray daemon have also been available for sending traces. Both moved to maintenance mode on February 25, 2026, and releases since then are limited to security fixes. AWS recommends migrating to OpenTelemetry instrumentation instead.
The Setup
The pieces line up like this.
- The application creates spans.
- The Collector receives them, converts them to X-Ray's format, and sends them on.
- X-Ray stores them, and the AWS CLI and Grafana read them back.
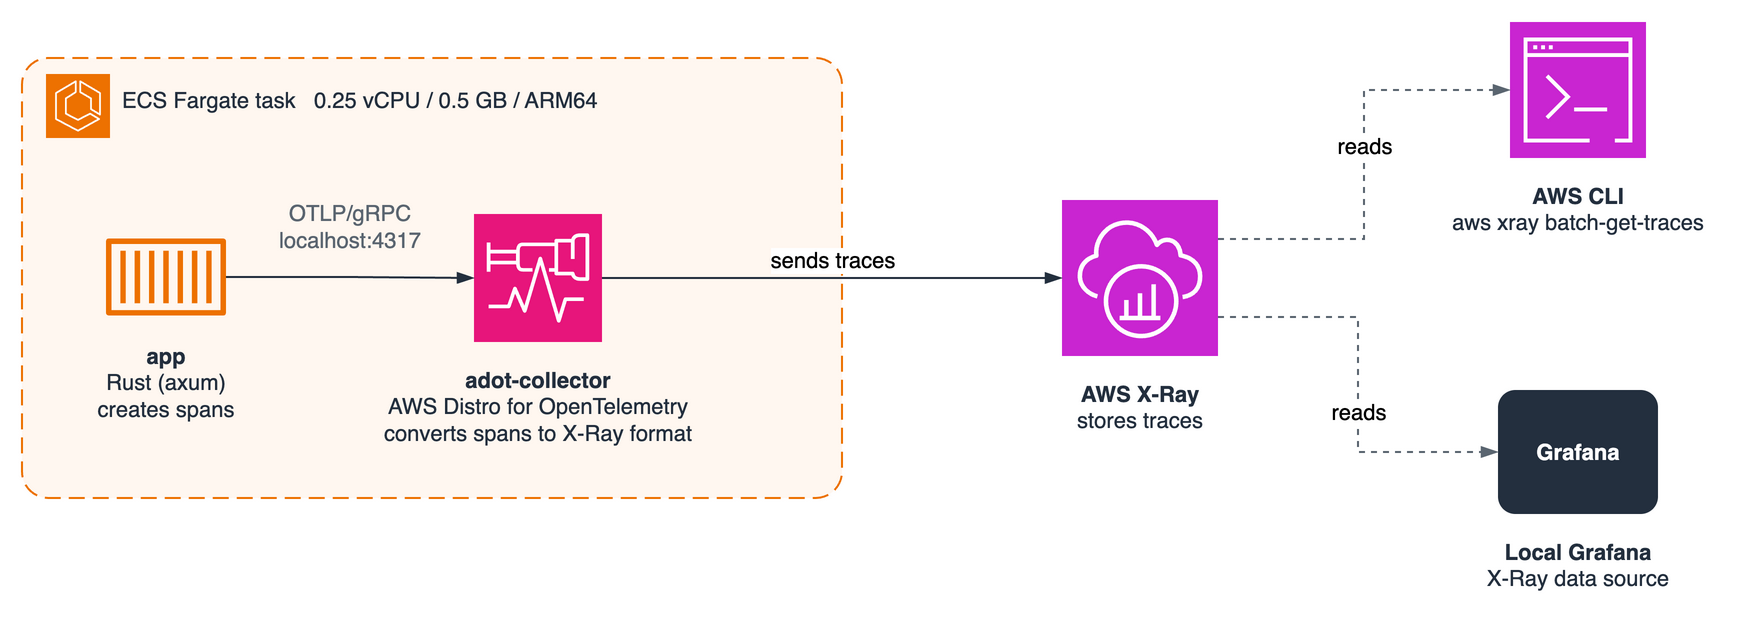
The app talks to the Collector over OTLP (OpenTelemetry Protocol), the shared wire format. OTLP comes in a gRPC and an HTTP flavor; this setup uses gRPC, whose default port is 4317.
For the Collector, ADOT (AWS Distro for OpenTelemetry) does the job. The ADOT Collector is AWS's distribution of the upstream OpenTelemetry Collector, bundled with the components needed to ship to AWS services such as X-Ray.
Where the Collector runs comes down to roughly three options.
- One resident per host
- A service dedicated to the Collector
- A sidecar in the same ECS task as the application
The third one is what this walkthrough uses. An ECS task is the unit that starts a group of containers together, and containers inside one task reach each other over localhost. Fargate rules out running a Collector as a host daemon, which is why the ADOT documentation presents the sidecar as the basic setup as well. The app and the Collector share a task and hand OTLP/gRPC data across localhost port 4317.
Two tools read the stored traces back here: the AWS CLI and a local Grafana.
Grafana is an open source visualization tool that displays the results of queries against the data sources you register. Those data sources cover X-Ray as well as CloudWatch metrics and logs and Prometheus, so telemetry that lands in different places per service can still be read from one screen. X-Ray goes in as the data source here, and the same traces come up in Grafana.
Environment
- AWS CLI v2, with a profile that authenticates through IAM Identity Center on a test account
- Docker (Rancher Desktop or Docker Desktop)
- Terraform v1.5 or later
- An Apple Silicon Mac
Terraform holds no credentials of its own here and reads the same credential chain as the AWS CLI. Sign in and confirm the account first.
bashaws sso login --profile <profile-name>
export AWS_PROFILE=<profile-name>
aws sts get-caller-identity
terraform apply runs against whatever account that third command prints.
Pin the region through the environment as well.
The provider block in main.tf names ap-northeast-1, so every resource Terraform creates lands in the Tokyo region. The AWS CLI calls from step 3 onward, meanwhile, use whatever default region the CLI is configured with.
When the two disagree, the CLI cannot find the ECS cluster Terraform created and returns ClusterNotFoundException.
bashexport AWS_REGION=ap-northeast-11. Building the Rust Application
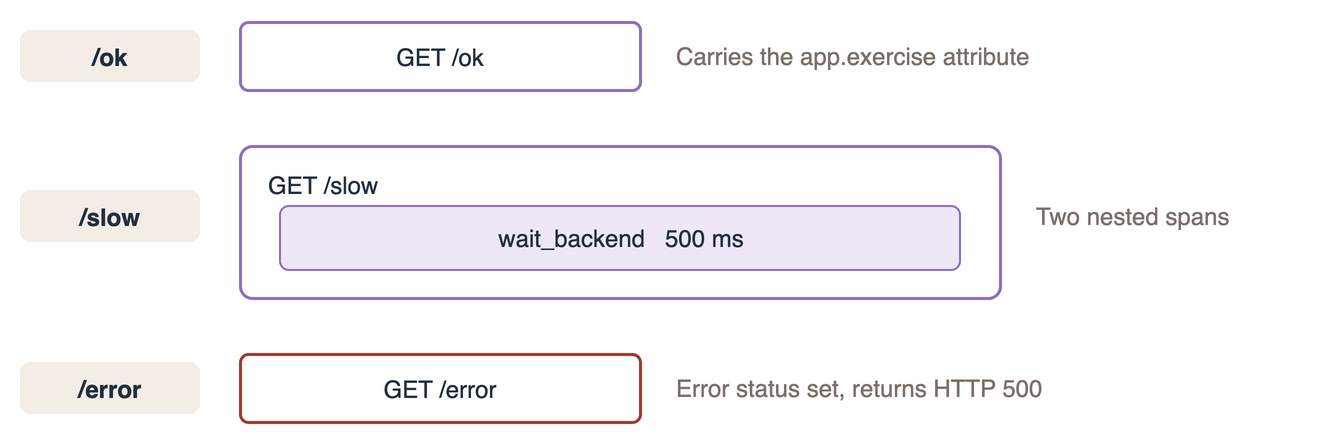
The app is a small HTTP server with three endpoints.
/ok— returns 200 right away./slow— waits 500 ms, then returns 200./error— returns 500.
Instrumentation adds three things: the dependency crates in Cargo.toml, the initialization at the top of main, and a span start and end inside each handler. Initialization decides where spans go and how; the handlers wrap the stretch of work worth measuring.
The files sit like this.
rust-xray-handson/
├── app/
│   ├── Cargo.toml
│   ├── Dockerfile
│   ├── .dockerignore
│   └── src/
│       └── main.rs
└── terraform/
    └── main.tf
Cargo.toml
toml[package]
name = "rust-xray-handson"
version = "0.1.0"
edition = "2024"

[dependencies]
axum = "0.8.9"                        # Web framework
opentelemetry = "0.32.0"              # API. Span operations are called from here
opentelemetry-otlp = { version = "0.32.0", features = ["grpc-tonic"] }  # Exporter. Ships over OTLP/gRPC
opentelemetry_sdk = "0.32.1"          # SDK. Buffers spans and hands them to the Exporter
tokio = { version = "1.53.1", features = ["full"] }  # Async runtime
Keep opentelemetry, opentelemetry_sdk, and opentelemetry-otlp on the same compatible minor version, the 0.32 line.
src/main.rs
rustuse std::time::Duration;

use axum::{http::StatusCode, routing::get, Router};
use opentelemetry::global::{self, BoxedTracer};
use opentelemetry::trace::{Span, Status, TraceContextExt, Tracer};
use opentelemetry::{Context, KeyValue};
use opentelemetry_sdk::trace::SdkTracerProvider;
use opentelemetry_sdk::Resource;

// Pulls a Tracer out of the TracerProvider registered in main
fn tracer() -> BoxedTracer {
    global::tracer("rust-xray-handson")
}

async fn ok_handler() -> &'static str {
    // Smallest example of setting an attribute. end() follows start() immediately,
    // so this does not measure the whole HTTP path
    let mut span = tracer().start("GET /ok");
    // An attribute is a key-value on the span, and a handle for narrowing a search later
    span.set_attribute(KeyValue::new("app.exercise", "first-trace"));
    span.end();
    "ok\n"
}

async fn slow_handler() -> &'static str {
    let tracer = tracer();
    let parent = tracer.start("GET /slow");
    // Put the parent span in a Context, then pass that Context to create the child span
    let cx = Context::current_with_span(parent);
    let mut child = tracer.start_with_context("wait_backend", &cx);
    tokio::time::sleep(Duration::from_millis(500)).await;
    child.end();
    // The parent comes back out of the Context to be ended
    cx.span().end();
    "slow\n"
}

async fn error_handler() -> (StatusCode, &'static str) {
    let mut span = tracer().start("GET /error");
    // Marks the span as an error. The backend renders it as a failure
    span.set_status(Status::error("simulated failure"));
    span.end();
    (StatusCode::INTERNAL_SERVER_ERROR, "error\n")
}

// ECS sends SIGTERM first when it stops a task. Wait for that before shutting down
async fn shutdown_signal() {
    use tokio::signal::unix::{signal, SignalKind};

    let mut term = signal(SignalKind::terminate()).expect("cannot install SIGTERM handler");
    let mut int = signal(SignalKind::interrupt()).expect("cannot install SIGINT handler");

    tokio::select! {
        _ = term.recv() => {}
        _ = int.recv() => {}
    }
    println!("shutdown signal received");
}

#[tokio::main]
async fn main() -> Result<(), Box<dyn std::error::Error + Send + Sync>> {
    // Exporter: ships buffered spans over OTLP/gRPC.
    // With no endpoint set, it sends to http://localhost:4317.
    // A sidecar in the same task is reachable over localhost
    let exporter = opentelemetry_otlp::SpanExporter::builder()
        .with_tonic()
        .build()?;
    // SDK: batches spans, stamps service.name and friends onto all of them,
    // and hands them to the Exporter
    let provider = SdkTracerProvider::builder()
        .with_batch_exporter(exporter)
        .with_resource(
            Resource::builder()
                .with_service_name("rust-xray-handson")
                .build(),
        )
        .build();
    // From here on, global::tracer() returns a Tracer from this provider
    global::set_tracer_provider(provider.clone());

    let app = Router::new()
        .route("/ok", get(ok_handler))
        .route("/slow", get(slow_handler))
        .route("/error", get(error_handler));

    let listener = tokio::net::TcpListener::bind("0.0.0.0:8080").await?;
    println!("listening on 0.0.0.0:8080");
    axum::serve(listener, app)
        .with_graceful_shutdown(shutdown_signal())
        .await?;

    // Only once execution reaches this line do the spans left in the batch finish shipping
    provider.shutdown()?;
    println!("tracer provider shut down");
    Ok(())
}
/ok creates one span carrying a single attribute, app.exercise = "first-trace", which serves as a handle for filtering traces later. /error also creates one span and sets an error status on it. /slow nests a child span for the wait inside the parent span for the whole request, so one request produces a parent and a child.
To keep the span mechanics easy to follow, none of this sets SpanKind::Server or the attributes from the HTTP semantic conventions. The spans therefore count as the default Internal spans rather than HTTP server spans. Section 6 puts that side by side with what a framework instrumentation library produces.
Flushing the Remaining Spans When the Task Stops
with_batch_exporter ships spans in batches, which can leave unsent spans behind at exit. This sample catches SIGTERM, stops axum, and waits on provider.shutdown() until the remaining spans are out.
The SDK's default sampler in this setup is ParentBased(AlwaysOn): it inherits the parent span's decision, and records everything when there is no parent. Sending all of it is fine for a test, but X-Ray bills by the number of recorded traces, so production calls for a sampler sized to the traffic.
Dockerfile
dockerfileFROM rust:1-slim AS builder
WORKDIR /build
COPY . .
RUN cargo build --release

FROM gcr.io/distroless/cc-debian12
COPY --from=builder /build/target/release/rust-xray-handson /rust-xray-handson
EXPOSE 8080
ENTRYPOINT ["/rust-xray-handson"]
.dockerignore holds a single line, target.
2. Deploying with Terraform
With the app and its Dockerfile in place, Terraform creates the image registry and the ECS Fargate runtime. The ECS service refers to an image in ECR, so the order matters.
- Create the ECR repository on its own.
- Build the container image and push it to ECR.
- Create everything else: the VPC, IAM roles, the ECS service.
Resources Terraform Creates
All the Terraform lives in one main.tf. Dropped in as rust-xray-handson/terraform/main.tf, it creates a VPC, public subnets, IAM roles, a CloudWatch Logs group, an ECS cluster, a task definition, and an ECS service.
Ota1022/rust-xray-handson
The Rust app, Dockerfile, and Terraform configuration used in this walkthrough.
The source allowed to reach port 8080 comes from the allowed_ingress_cidr variable, which takes only a /32 IPv4 CIDR. The deployment steps set it from your own public IP address.
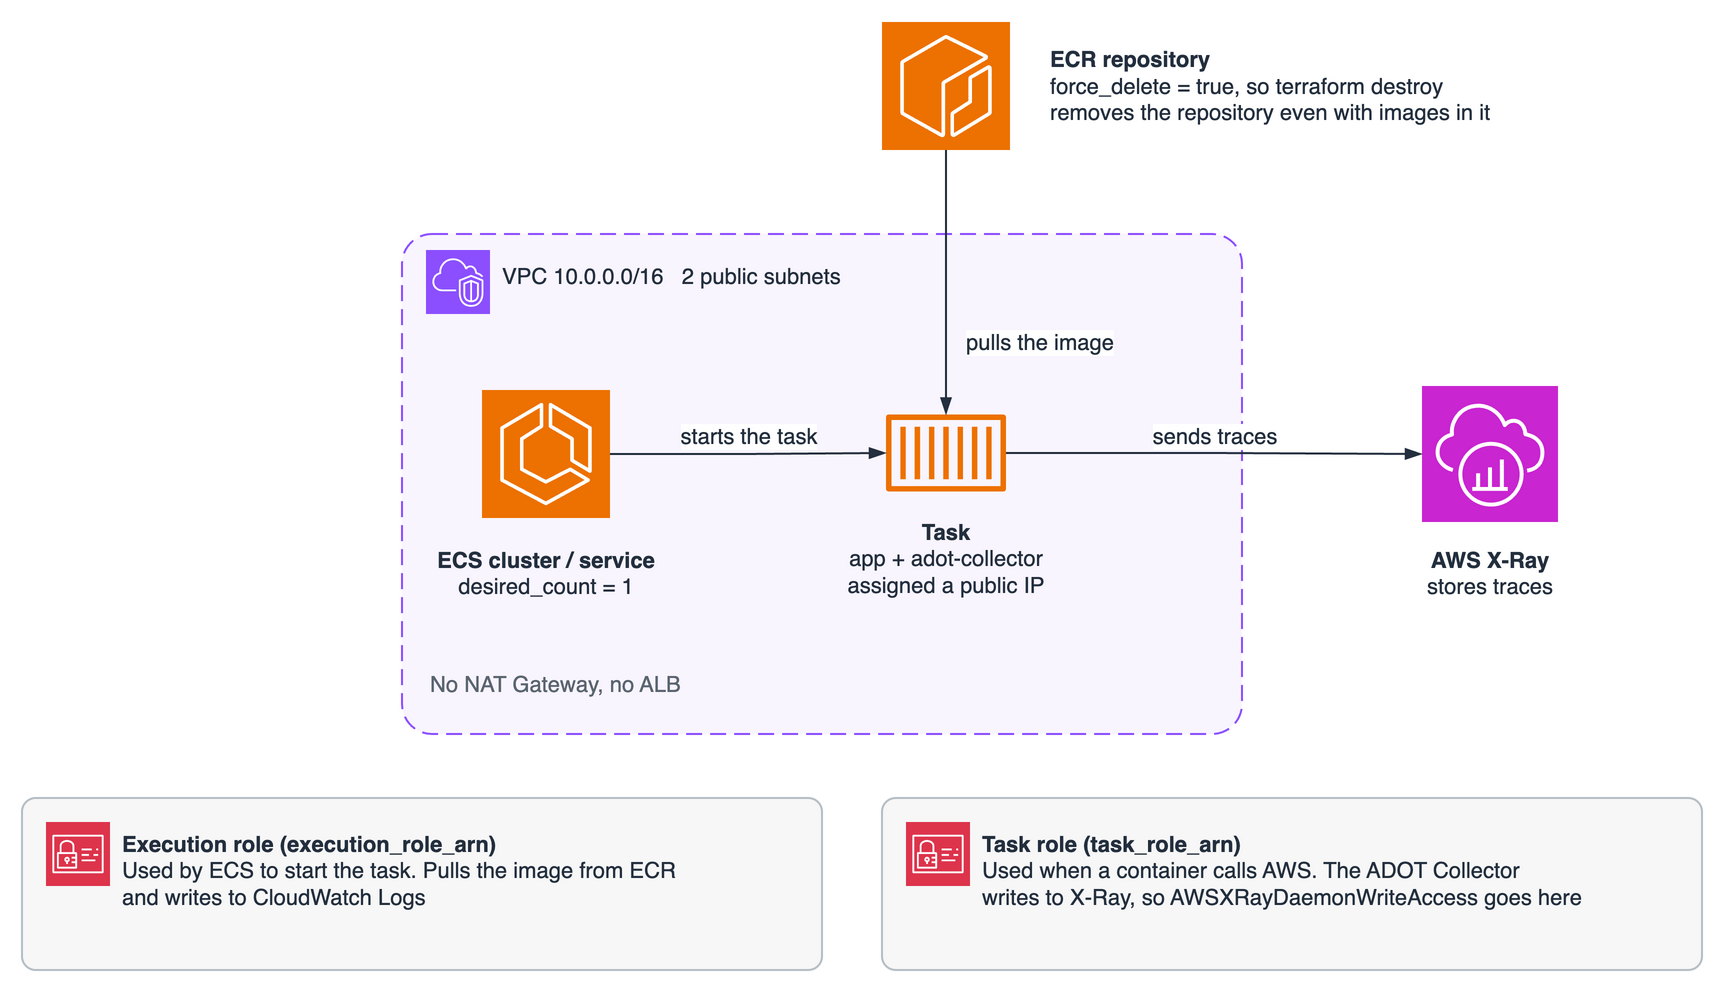
Three decisions shape the rest.
- No NAT Gateway and no ALB. Tasks sit directly in a public subnet to keep the cost down.
- The task role carries
AWSXRayDaemonWriteAccessandCloudWatchAgentServerPolicy. The ADOT Collector's ECS default config has a metrics pipeline to CloudWatch alongside the traces pipeline to X-Ray, so this sample grants write access to both. The application itself sends traces only. - The ECR repository sets
force_delete = true.terraform destroyremoves the repository even with images still in it.
The ECS Task and the Collector Config
One task definition holds both the app and the ADOT Collector.
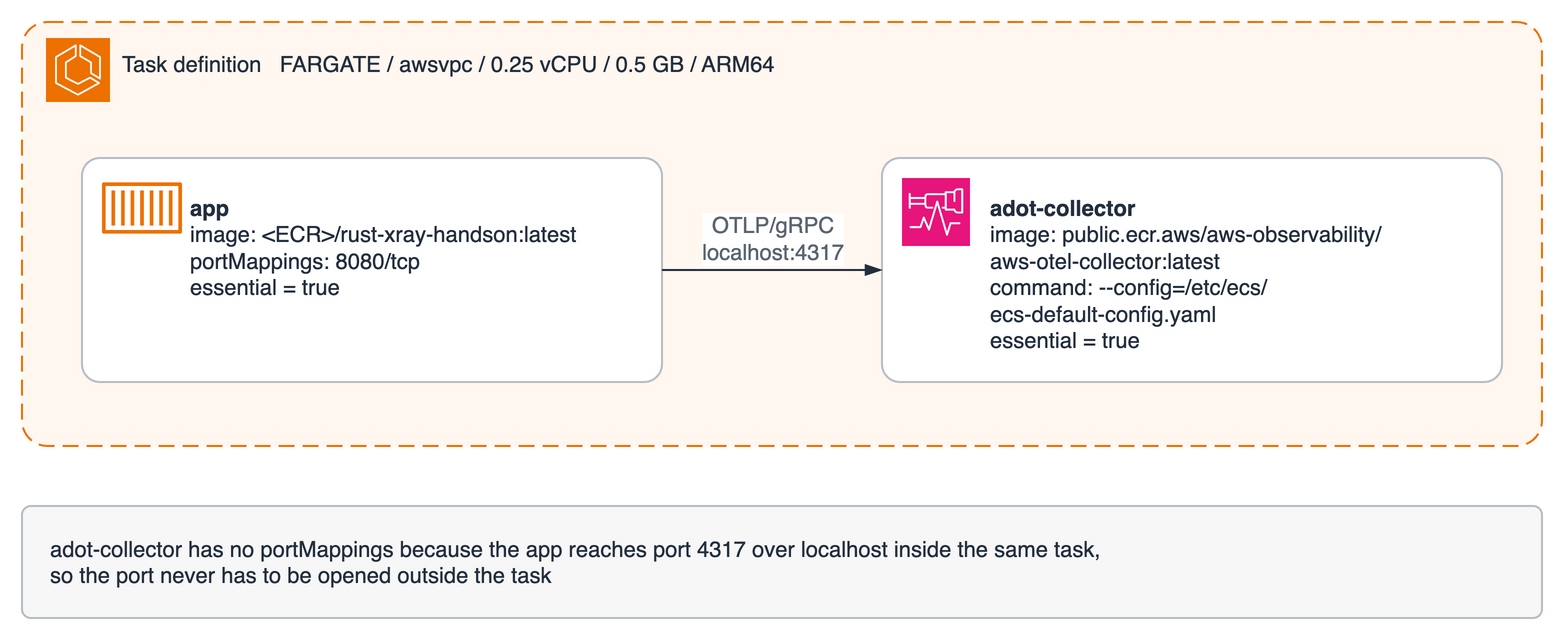
Here is that task definition with only the CloudWatch Logs configuration left out.
hclresource "aws_ecs_task_definition" "main" {
  family                   = local.name
  requires_compatibilities = ["FARGATE"]
  network_mode             = "awsvpc"
  cpu                      = "256"
  memory                   = "512"
  execution_role_arn       = aws_iam_role.execution.arn
  task_role_arn            = aws_iam_role.task.arn

  runtime_platform {
    operating_system_family = "LINUX"
    cpu_architecture        = "ARM64"
  }

  container_definitions = jsonencode([
    {
      name         = "app"
      image        = "${aws_ecr_repository.app.repository_url}:latest"
      essential    = true
      portMappings = [{ containerPort = 8080, protocol = "tcp" }]
    },
    {
      name      = "adot-collector"
      image     = "public.ecr.aws/aws-observability/aws-otel-collector:latest"
      essential = true
      command   = ["--config=/etc/ecs/ecs-default-config.yaml"]
    }
  ])
}
The Collector runs the ECS config that ships inside the image.
yamlextensions:
  health_check:

receivers:
  otlp:
    protocols:
      grpc:
        endpoint: 0.0.0.0:4317
      http:
        endpoint: 0.0.0.0:4318
  awsxray:
    endpoint: 0.0.0.0:2000
    transport: udp
  statsd:
    endpoint: 0.0.0.0:8125
    aggregation_interval: 60s

processors:
  batch/traces:
    timeout: 1s
    send_batch_size: 50
  batch/metrics:
    timeout: 60s

exporters:
  awsxray:
  awsemf:
    namespace: ECS/AWSOTel/Application
    log_group_name: '/aws/ecs/application/metrics'

service:
  pipelines:
    traces:
      receivers: [otlp, awsxray]
      processors: [batch/traces]
      exporters: [awsxray]
    metrics:
      receivers: [otlp, statsd]
      processors: [batch/metrics]
      exporters: [awsemf]
  extensions: [health_check]
The otlp receiver takes data over gRPC on port 4317 and HTTP on port 4318. The traces pipeline groups incoming traces through the batch/traces processor and sends them to X-Ray through the awsxray exporter. The default config also carries a metrics pipeline, which takes metrics received over OTLP or StatsD through the batch/metrics processor and out to CloudWatch through the awsemf exporter. This sample's application sends traces alone, and CloudWatchAgentServerPolicy is there so the default config's metrics pipeline stays usable.
The Collector has no portMappings because traffic from the app stays on localhost inside the same ECS task, and port 4317 never has to be exposed outside it.
This example pins the ADOT Collector to :latest to keep the test simple. Production should pin a version you have verified, or an image digest, so an update cannot change behavior underneath you.
runtime_platform is ARM64 to match an image built on Apple Silicon. Building on x86_64 means changing it to X86_64.
Deployment
The apply runs in two passes. Because the ECS task definition points at an image in ECR, creating the service before pushing the image leaves the task failing to start over and over. -target creates the ECR repository first.
bashcd rust-xray-handson/terraform
export TF_VAR_allowed_ingress_cidr="$(curl -sS https://checkip.amazonaws.com)/32"
terraform init
terraform apply -target=aws_ecr_repository.app
-target is not meant for routine Terraform use; it exists for exceptional situations. It appears here as a convenience so that one sample configuration can walk through create ECR, push image, create ECS.
bashACCOUNT_ID=$(aws sts get-caller-identity --query Account --output text)
REPO="$ACCOUNT_ID.dkr.ecr.ap-northeast-1.amazonaws.com/rust-xray-handson"
aws ecr get-login-password --region ap-northeast-1 | \
  docker login --username AWS --password-stdin "${REPO%/*}"
docker build -t "$REPO:latest" ../app
docker push "$REPO:latest"
With the image in place, the rest goes up in one shot.
bashterraform applyThe second terraform apply creates everything left over: the VPC, IAM roles, CloudWatch Logs, the ECS cluster, the task definition, and the ECS service. Wait for the service to stabilize and the task to reach RUNNING.
bashaws ecs wait services-stable \
  --cluster rust-xray-handson \
  --services rust-xray-handson
aws ecs describe-services \
  --cluster rust-xray-handson \
  --services rust-xray-handson \
  --query 'services[0].{desired:desiredCount,running:runningCount}'
Once desired and running both read 1, the task holding the app and the ADOT Collector is up. The next step picks up that task's public IP and sends requests to it.
3. Generating Traces with curl
Spans appear when a request gets handled, so traces need requests.
With no ALB in the setup, requests go straight to the task's public IP. Look that up first.
Terraform limited the source for port 8080 to your own public IP address, so only this machine can reach it.
bashTASK_ARN=$(aws ecs list-tasks --cluster rust-xray-handson --query 'taskArns[0]' --output text)
ENI_ID=$(aws ecs describe-tasks --cluster rust-xray-handson --tasks "$TASK_ARN" \
  --query "tasks[0].attachments[0].details[?name=='networkInterfaceId'].value" --output text)
aws ec2 describe-network-interfaces --network-interface-ids "$ENI_ID" \
  --query 'NetworkInterfaces[0].Association.PublicIp' --output text
Send a few requests to each of the three endpoints on the IP that comes back.
bashIP=<the IP from above>
curl http://$IP:8080/ok
curl http://$IP:8080/slow
curl http://$IP:8080/error
4. Reading the Segments with the AWS CLI
OpenTelemetry calls a leg of a trace a span; X-Ray stores trace data as segments and subsegments. The X-Ray exporter in the ADOT Collector converts OpenTelemetry spans into X-Ray's format before sending them. Fetching a segment directly shows which field each line of code turned into. batch-get-traces needs a trace ID, so take one from the last ten minutes of traces.
bashTRACE_ID=$(aws xray get-trace-summaries \
  --start-time "$(date -v-10M +%s)" --end-time "$(date +%s)" \
  --query 'TraceSummaries[0].Id' --output text)
aws xray batch-get-traces --trace-ids "$TRACE_ID"
The segment itself arrives as a JSON string in Segments[].Document in the response. Below is a real /ok segment, formatted.
json{
  "id": "826f1f41cf80f773",
  "name": "GET /ok",
  "start_time": 1788059844.007899,
  "trace_id": "1-9cb42327-fe31b713c474041f9862d0a9",
  "end_time": 1788059844.007901,
  "fault": false,
  "error": false,
  "throttle": false,
  "aws": {
    "xray": {
      "auto_instrumentation": false,
      "sdk_version": "0.32.1",
      "sdk": "opentelemetry for rust"
    }
  },
  "metadata": {
    "default": {
      "otel.resource.telemetry.sdk.name": "opentelemetry",
      "app.exercise": "first-trace",
      "otel.resource.service.name": "rust-xray-handson",
      "otel.resource.telemetry.sdk.language": "rust",
      "otel.resource.telemetry.sdk.version": "0.32.1"
    }
  }
}
Adding the /slow and /error segments, everything written in code turns up somewhere specific.
| Written in code | Where it lands in X-Ray |
|---|---|
The span name GET /ok | name on the segment |
KeyValue::new("app.exercise", "first-trace") | metadata.default.app.exercise |
Status::error("simulated failure") | fault: true and cause.exceptions[0].message |
The child span wait_backend | subsegments[] on the parent segment (measured at 500.7 ms) |
with_service_name("rust-xray-handson") | metadata.default.otel.resource.service.name |
Because these spans never set SpanKind::Server, the span name carries straight over as the name of the X-Ray segment, so GET /ok, GET /slow, and GET /error end up as three separate segment names. An instrumentation library for HTTP servers sets a Server span and HTTP attributes, which changes how the same request looks in X-Ray.
5. Viewing the X-Ray Traces in Grafana
The same traces also come up in Grafana, which runs here as a local Docker container.
Starting Grafana
The X-Ray data source needs AWS credentials. A provisioning file hands them over.
yaml# provisioning/datasources/xray.yaml
apiVersion: 1
datasources:
  - name: X-Ray
    type: grafana-x-ray-datasource
    isDefault: true
    jsonData:
      authType: keys
      defaultRegion: ap-northeast-1
    secureJsonData:
      accessKey: $AWS_ACCESS_KEY_ID
      secretKey: $AWS_SECRET_ACCESS_KEY
      sessionToken: $AWS_SESSION_TOKEN
Start Grafana from the directory holding that file.
basheval "$(aws configure export-credentials --format env)"
docker run -d --rm --name grafana-xray -p 127.0.0.1:3001:3000 \
  -e GF_PLUGINS_PREINSTALL=grafana-x-ray-datasource@2.17.1 \
  -e AWS_ACCESS_KEY_ID -e AWS_SECRET_ACCESS_KEY -e AWS_SESSION_TOKEN \
  -v "$(pwd)/provisioning:/etc/grafana/provisioning:ro" \
  grafana/grafana:13.2.0
Reading a Trace in Grafana
Open http://127.0.0.1:3001 and sign in with admin / admin. The X-Ray data source is already registered.
In Explore, setting Query Type to Trace List and the range to Last 1 hour lists the traces stored in X-Ray.
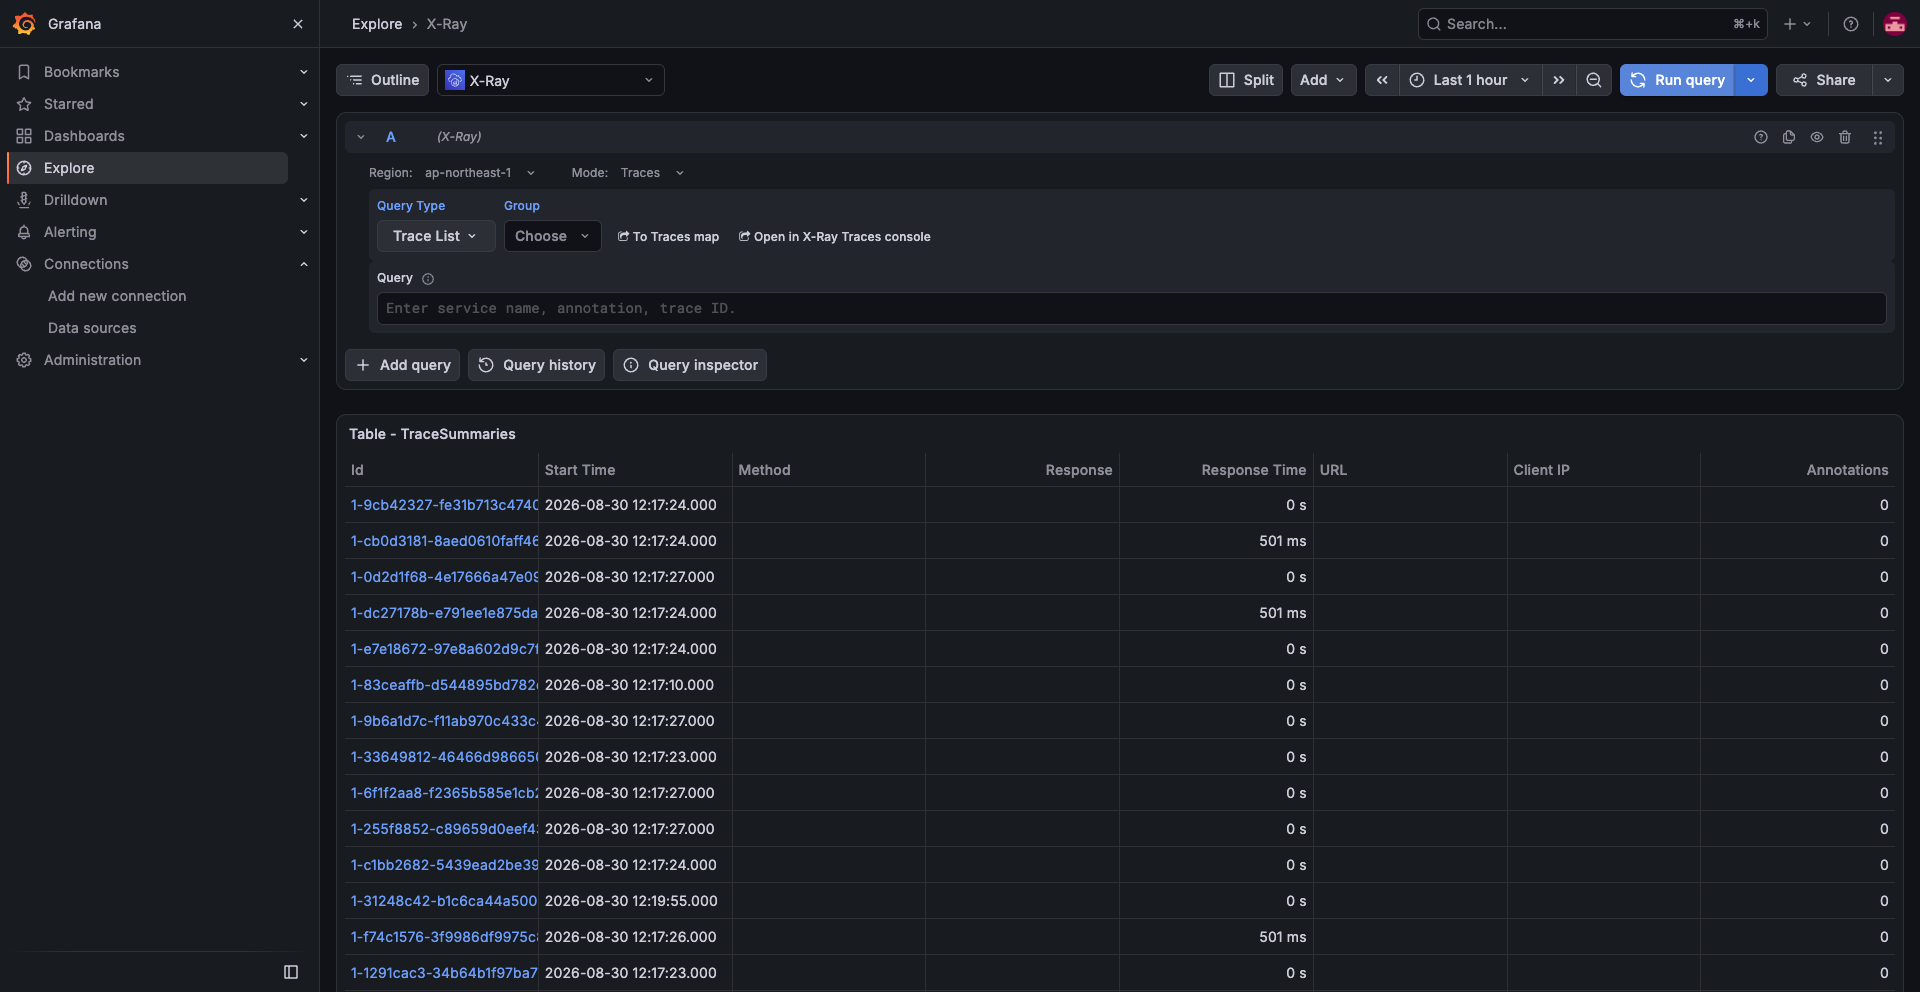
Opening a trace ID from the list switches to a timeline.
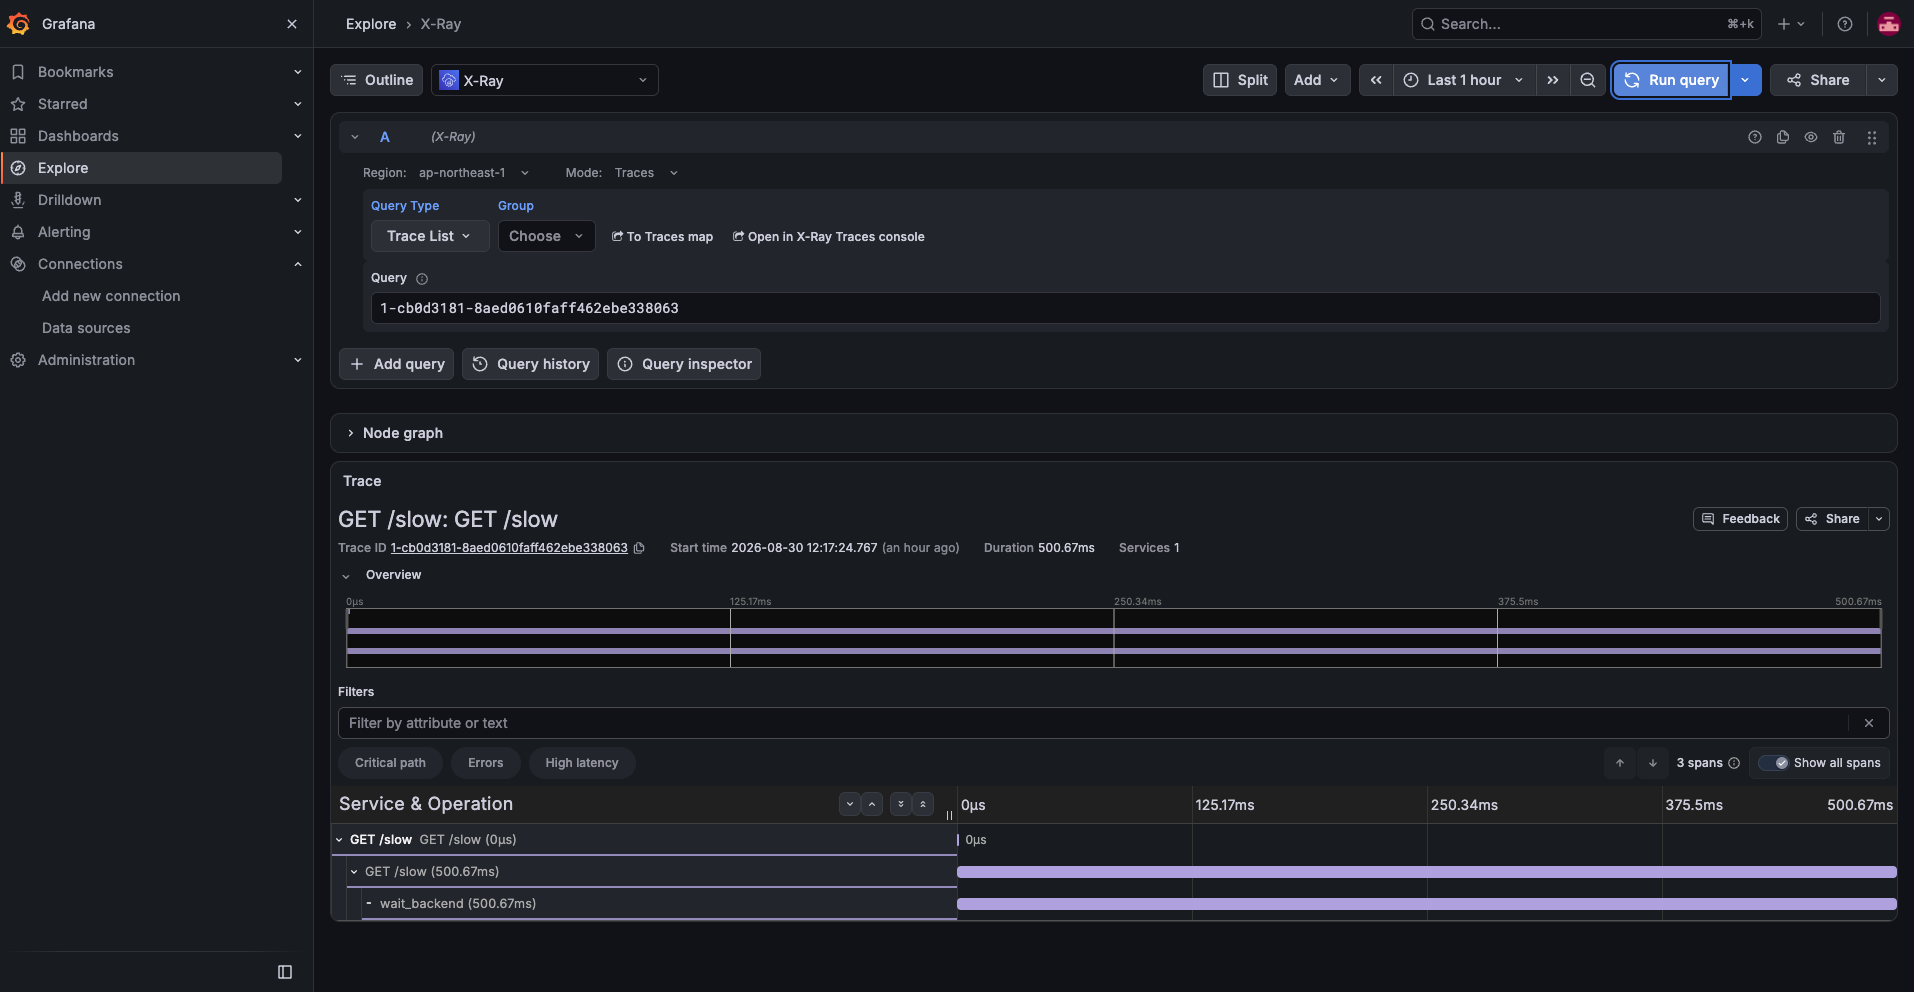
wait_backend nests under GET /slow and accounts for 500.67 ms. The parent and child built with start_with_context in the code arrive in exactly that shape. Grafana adds one root span above the segment in this view, which is why the span count reads 3.
The /error trace is next.
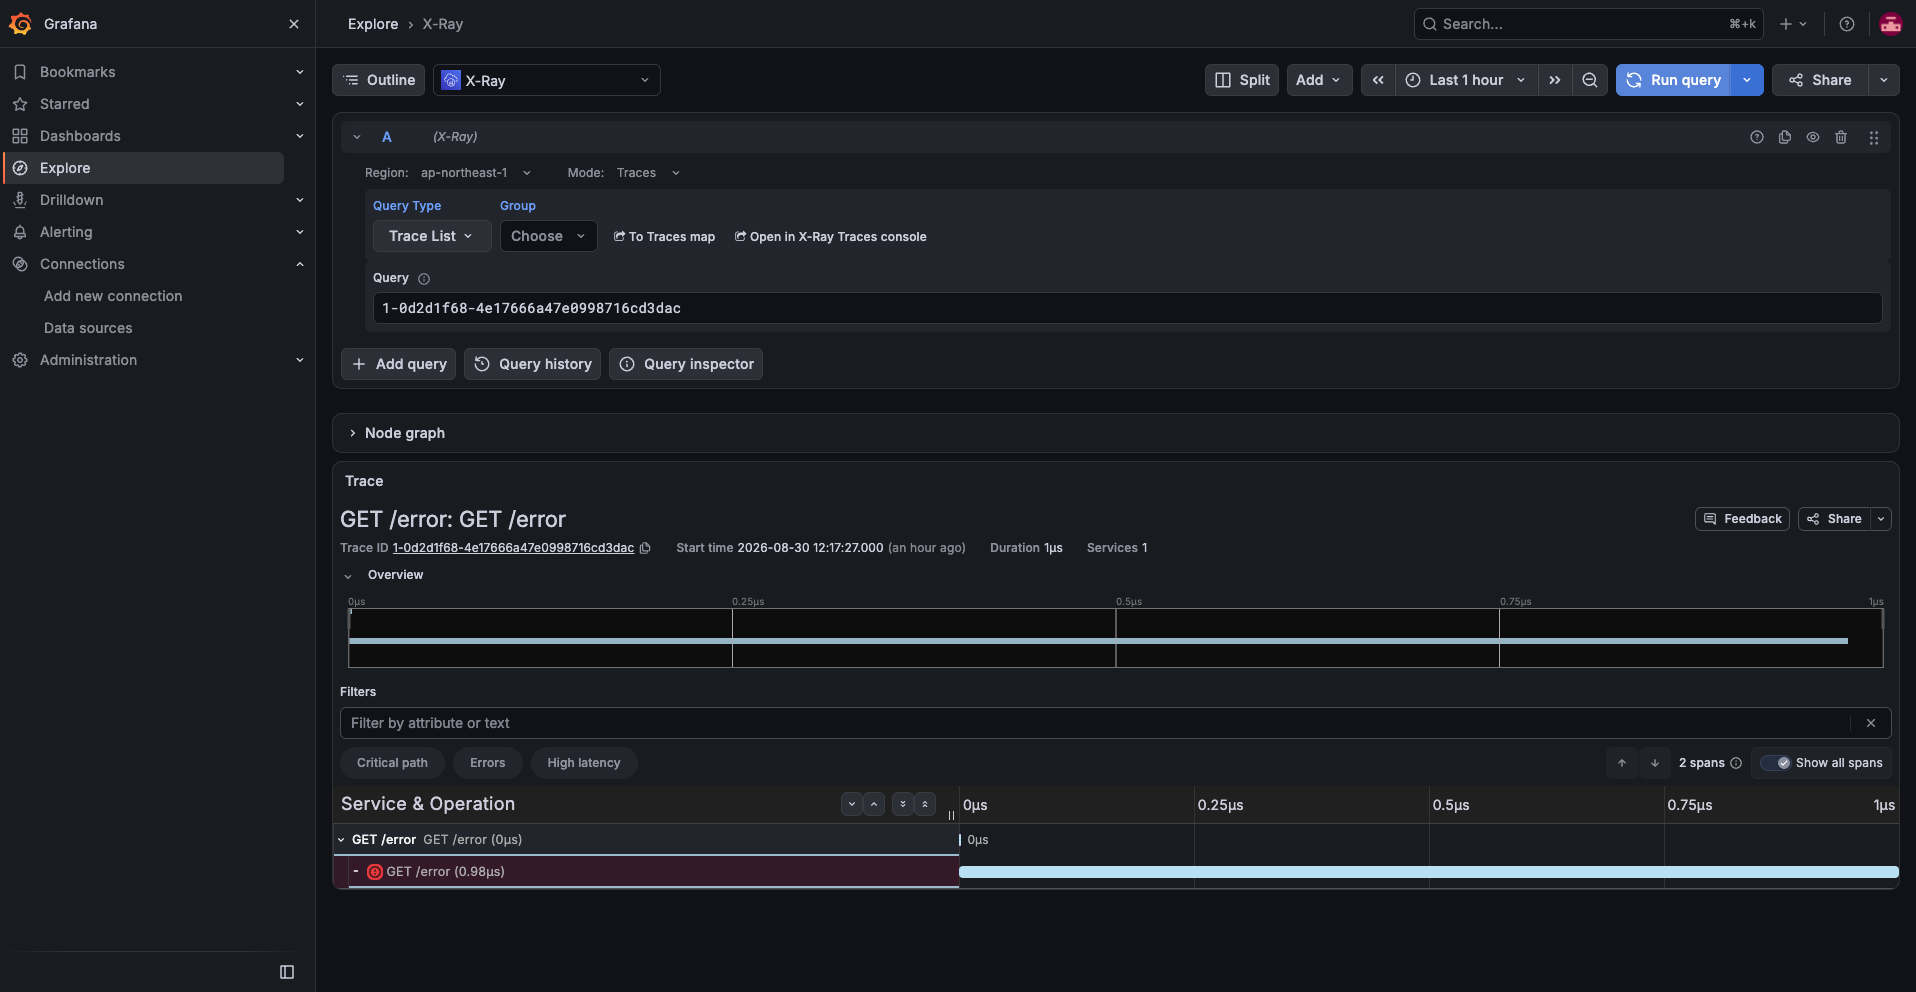
A span carrying Status::error picks up a red marker. What showed as fault: true in the X-Ray segment reads as that icon here.
6. What an Instrumentation Library Changes
Every span so far has been written by hand. So what changes when a framework instrumentation library does the work?
The comparison here is against src/shipping, the Rust service in the official OpenTelemetry demo, which runs the same OpenTelemetry 0.32 line as this walkthrough.
| Aspect | This article (hand-written) | Official demo (instrumentation library) |
|---|---|---|
| Instrumentation | A span written by hand in each handler | Middleware from opentelemetry-instrumentation-actix-web |
| SpanKind | Unset, so Internal | HTTP requests become Server spans |
| Response time | Depends on where span.end() sits, and can come out at zero. The /ok segment covers 2 µs, while the measured response takes about 20 ms | The whole request becomes one span |
| HTTP attributes | Not set, so the method and status columns in the trace list stay empty | Generated per the semantic conventions |
| Propagator | Not configured | TraceContextPropagator set explicitly |
| Resource | service.name set explicitly, nothing else | Host, OS, and Process detectors |
| Signals | Traces only | Traces, logs, and metrics |
| Shutdown | One provider.shutdown() | Three, in order: tracer, logger, meter |
Manual instrumentation leaves the SpanKind and the attributes up to you, not just the boundaries of what gets measured. For standardized work such as an HTTP request, an instrumentation library makes semantic-convention information much easier to attach. Application-specific internals like wait_backend, on the other hand, are what a manual span covers well. Letting a library catch the common paths and filling in the rest by hand looks like the combination that is easiest to work with.
7. What It Cost
Most of the ongoing cost of this test comes from the Fargate task and the public IPv4 address. ECR image storage adds usage-based charges on top of those.
| Item | Breakdown (Tokyo region) | Per hour |
|---|---|---|
| Fargate ARM (vCPU) | 0.25 vCPU × $0.04045/h | $0.01011 |
| Fargate ARM (memory) | 0.5 GB × $0.00442/GB-h | $0.00221 |
| Public IPv4 | 1 address × $0.005/h | $0.00500 |
| Total | $0.01732 |
The unit prices are the figures returned by the AWS Price List API.
Tear the test environment down once Grafana has served its purpose. X-Ray keeps traces for 30 days, so they stay readable after that.
bashterraform destroySummary
This walkthrough created OpenTelemetry spans by hand in a Rust application and shipped them to X-Ray through an ADOT Collector on ECS Fargate.
Reading the result back showed that sending spans is only part of the work. Where you cut a span, which SpanKind and attributes it carries, and how you build the parent-child links all change what the observability backend shows.
Writing spans by hand makes the path from creation to delivery easy to follow. For common work such as an HTTP request, though, the SpanKind and the semantic-convention attributes are yours to set. For a real application, catching request boundaries with a framework instrumentation library and covering application-specific work with manual spans looks like a reasonable option.