KubeCon + CloudNativeCon Japan 2026 took place in Yokohama on July 29 and 30, and I spent both days at the venue. The sessions I kept coming back to covered cloud native infrastructure for AI, proxyless gRPC, observability, and the limits teams set around AI agents. This post follows those threads, along with a few scenes from the conference floor.
A Japanese version of this report was originally published on the Sreake Blog.
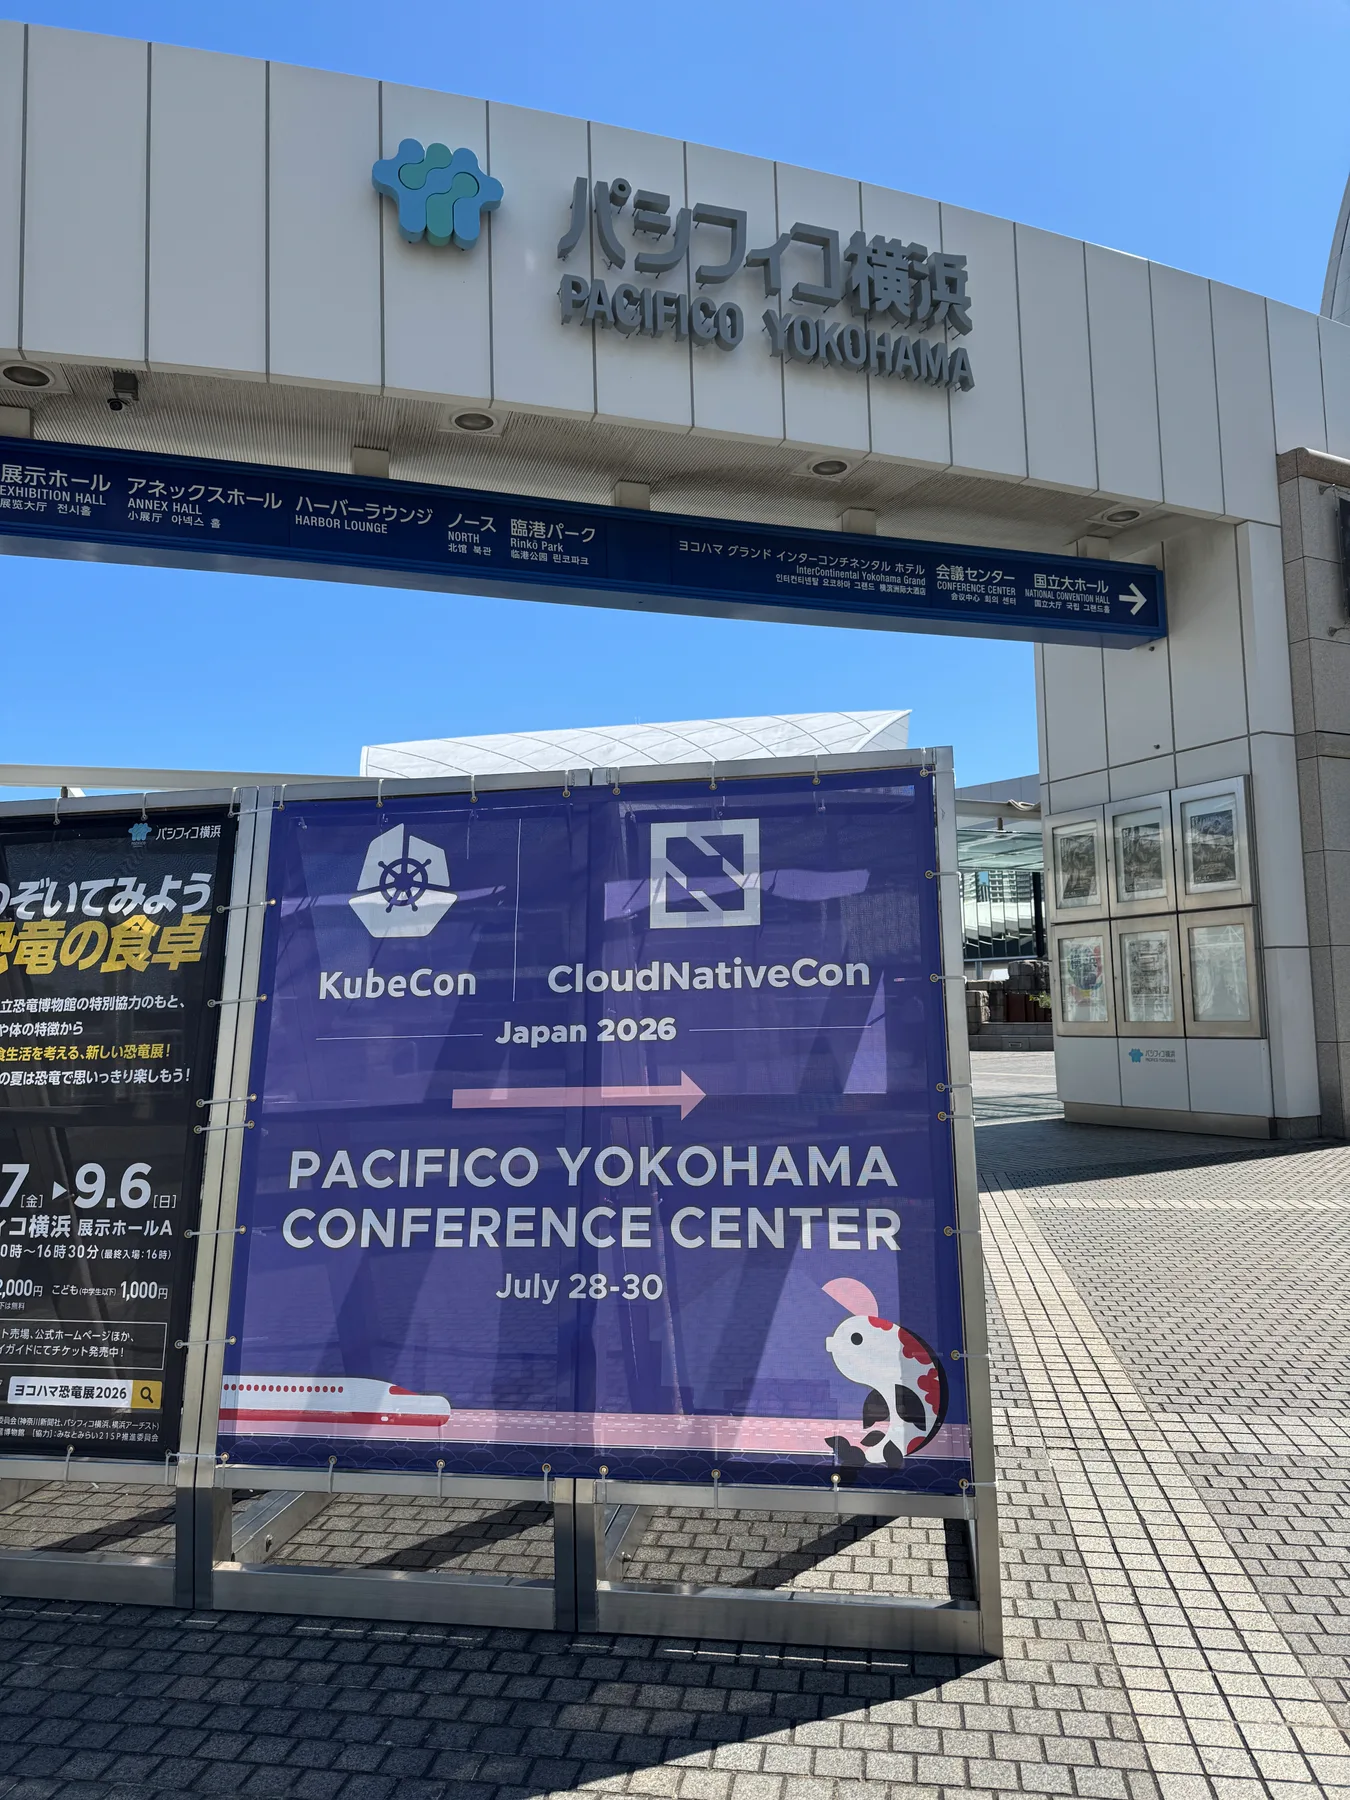
What Is KubeCon + CloudNativeCon Japan?
KubeCon + CloudNativeCon is the cloud native technology conference put on by the Cloud Native Computing Foundation (CNCF). Kubernetes sits at the center, with talks and community activities covering containers, connectivity, monitoring, security, AI infrastructure, and the work of running open source in production.
KubeCon runs all over the world, with five editions on the calendar for 2026: Europe (March, Amsterdam), India (June, Mumbai), Japan (July, Yokohama), China (September, Shanghai), and North America (November, Salt Lake City).
Japan's edition is in its second year, and ArgoCon Japan, KeycloakCon Japan, and Japan Community Day were all co-located the day before.
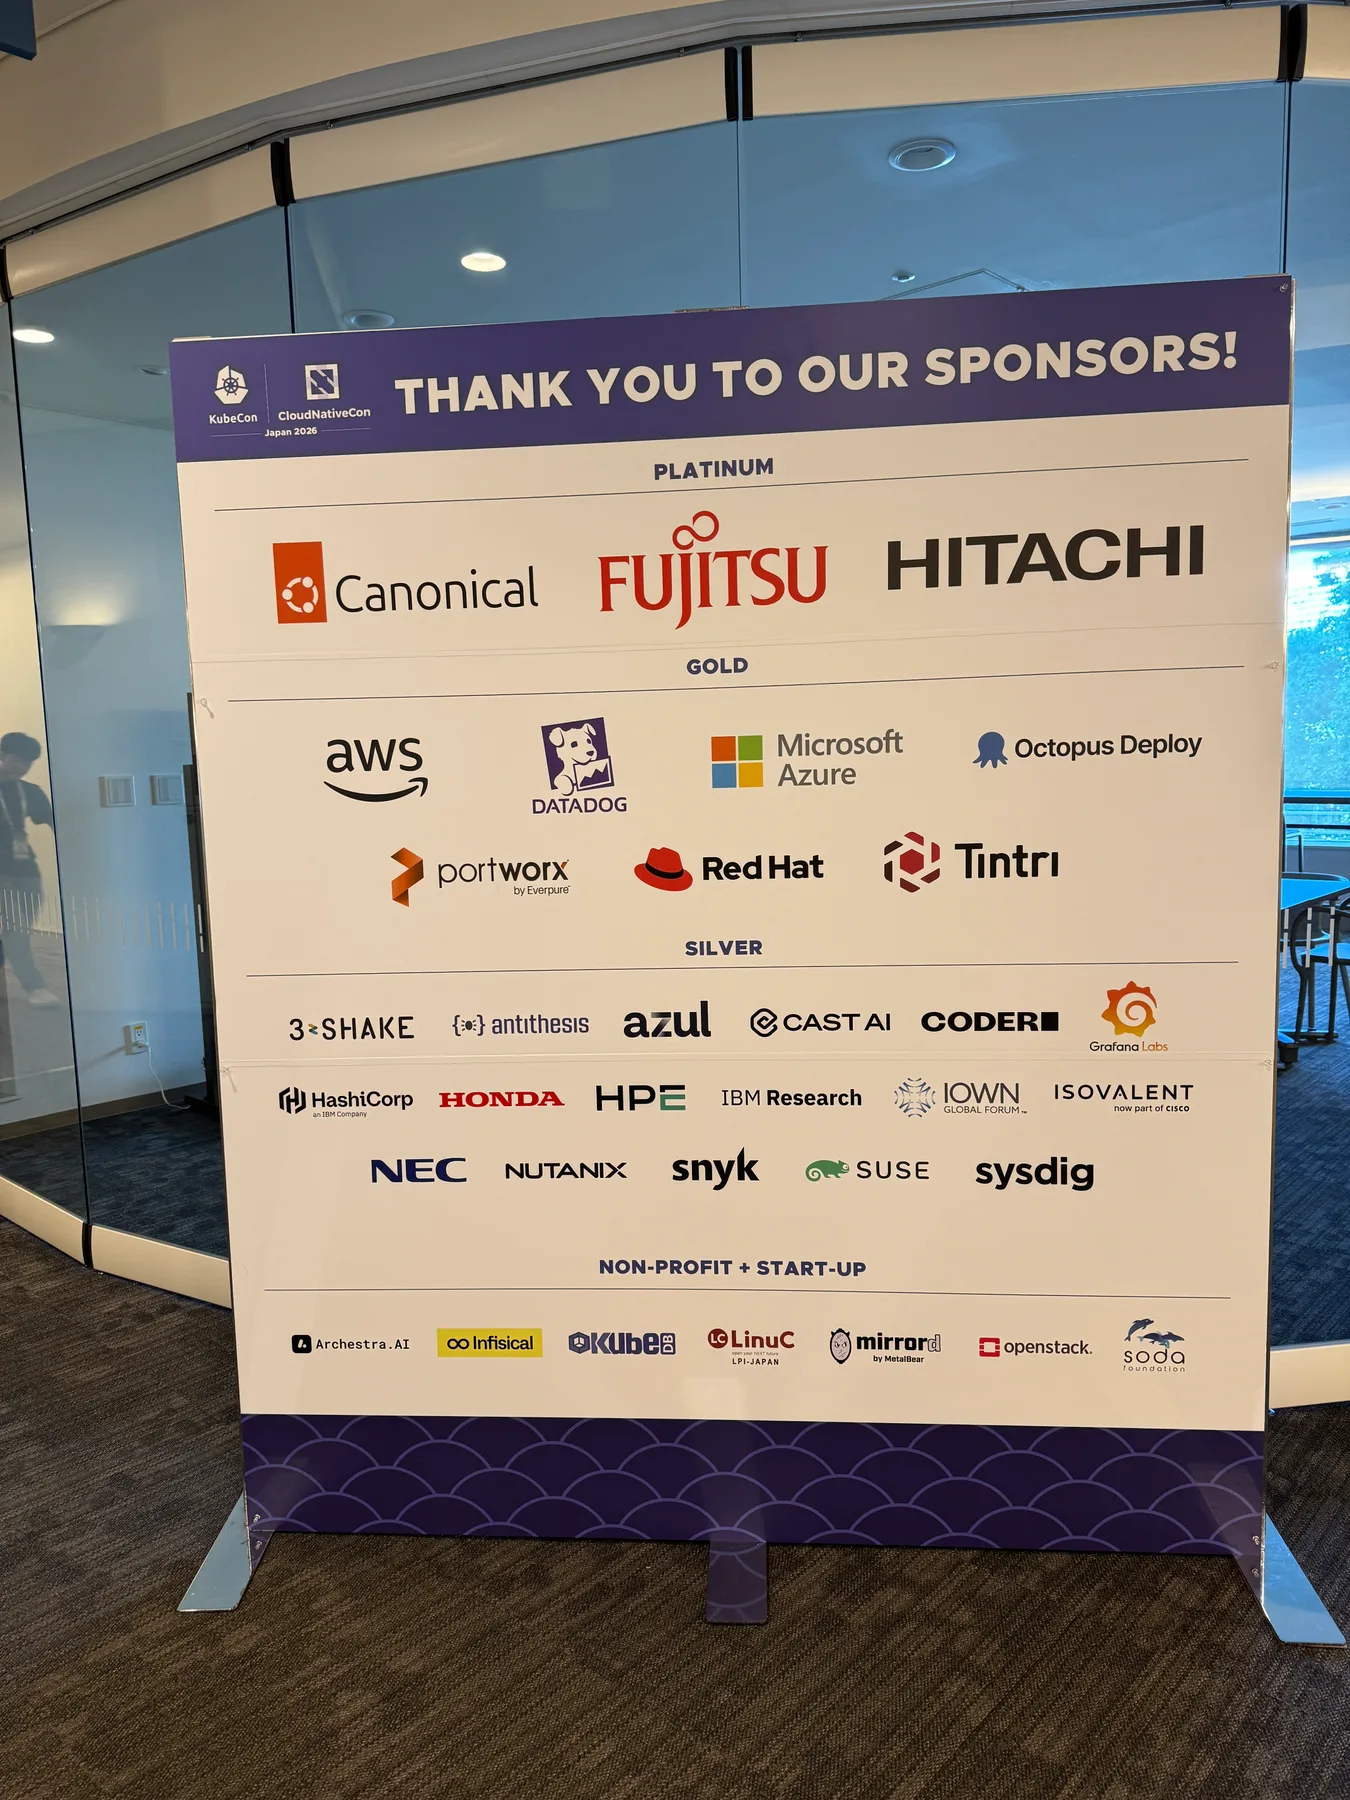
I attended with 3-shake, one of the event's silver sponsors.
The program covered a lot of ground, with tracks for AI + ML, Cloud Native Novice, Connectivity, Observability, Operations + Performance, Platform Engineering, Security, and more.
Many breakout sessions on the schedule carry an audience level — Beginner, Intermediate, Advanced, or Any. I work mainly on application development, so my Kubernetes experience only goes so far, and that labeling let me line up sessions in advance around what I was curious about and what touches my day job.
Where cloud native stands today
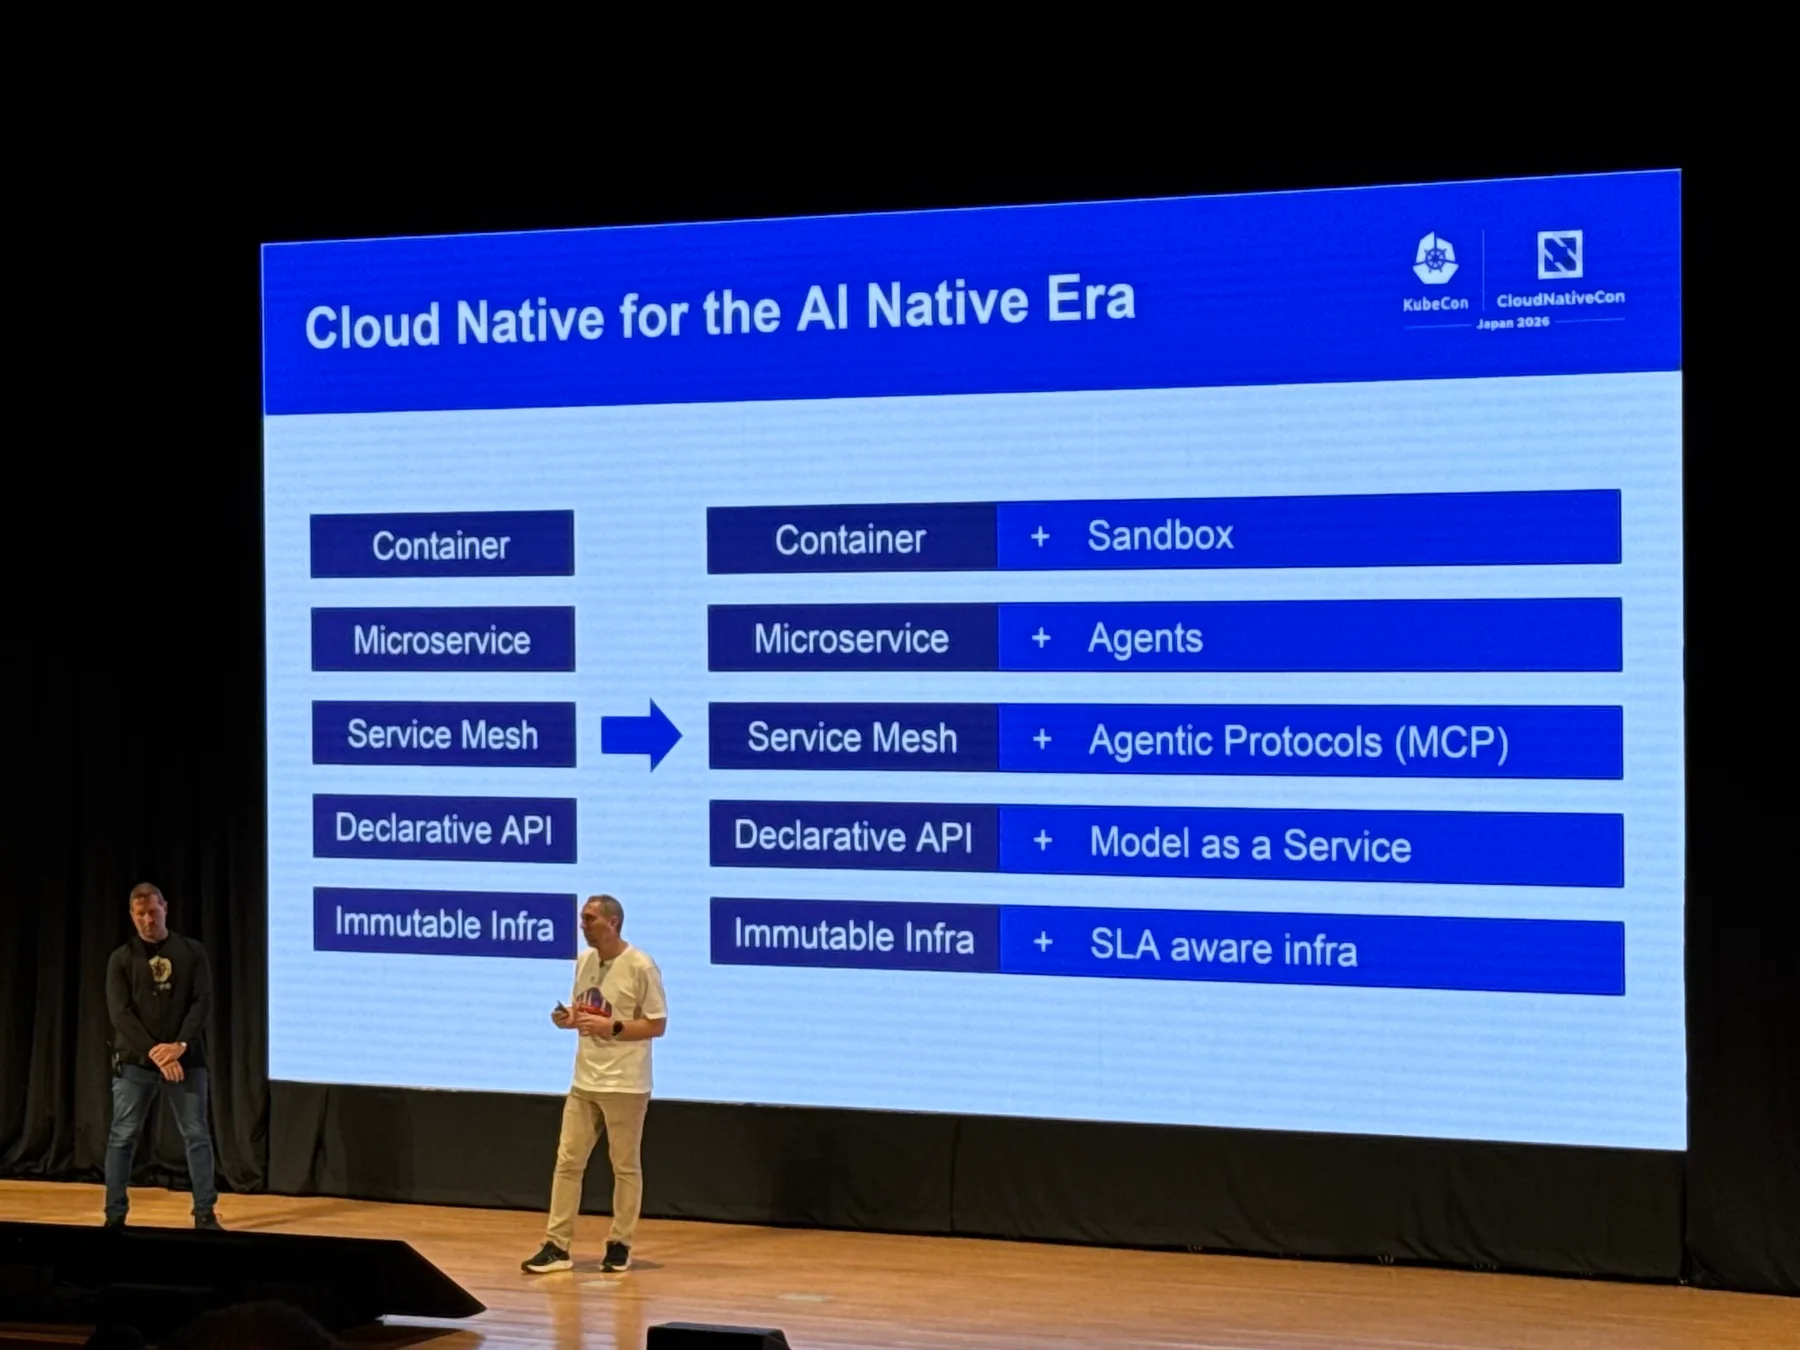
The keynotes set out a direction: take what cloud native has learned over ten years and apply it to AI workloads. Large-scale inference needs distributed processing, orchestration, networking, observability, and scheduling — the same ground the cloud native community has been working on all along. The slides put the parallels side by side: containers and sandboxes, microservices and agents, service mesh and agentic protocols like MCP, declarative APIs and Model as a Service.
The State of Cloud Native: The Shift Towards AI
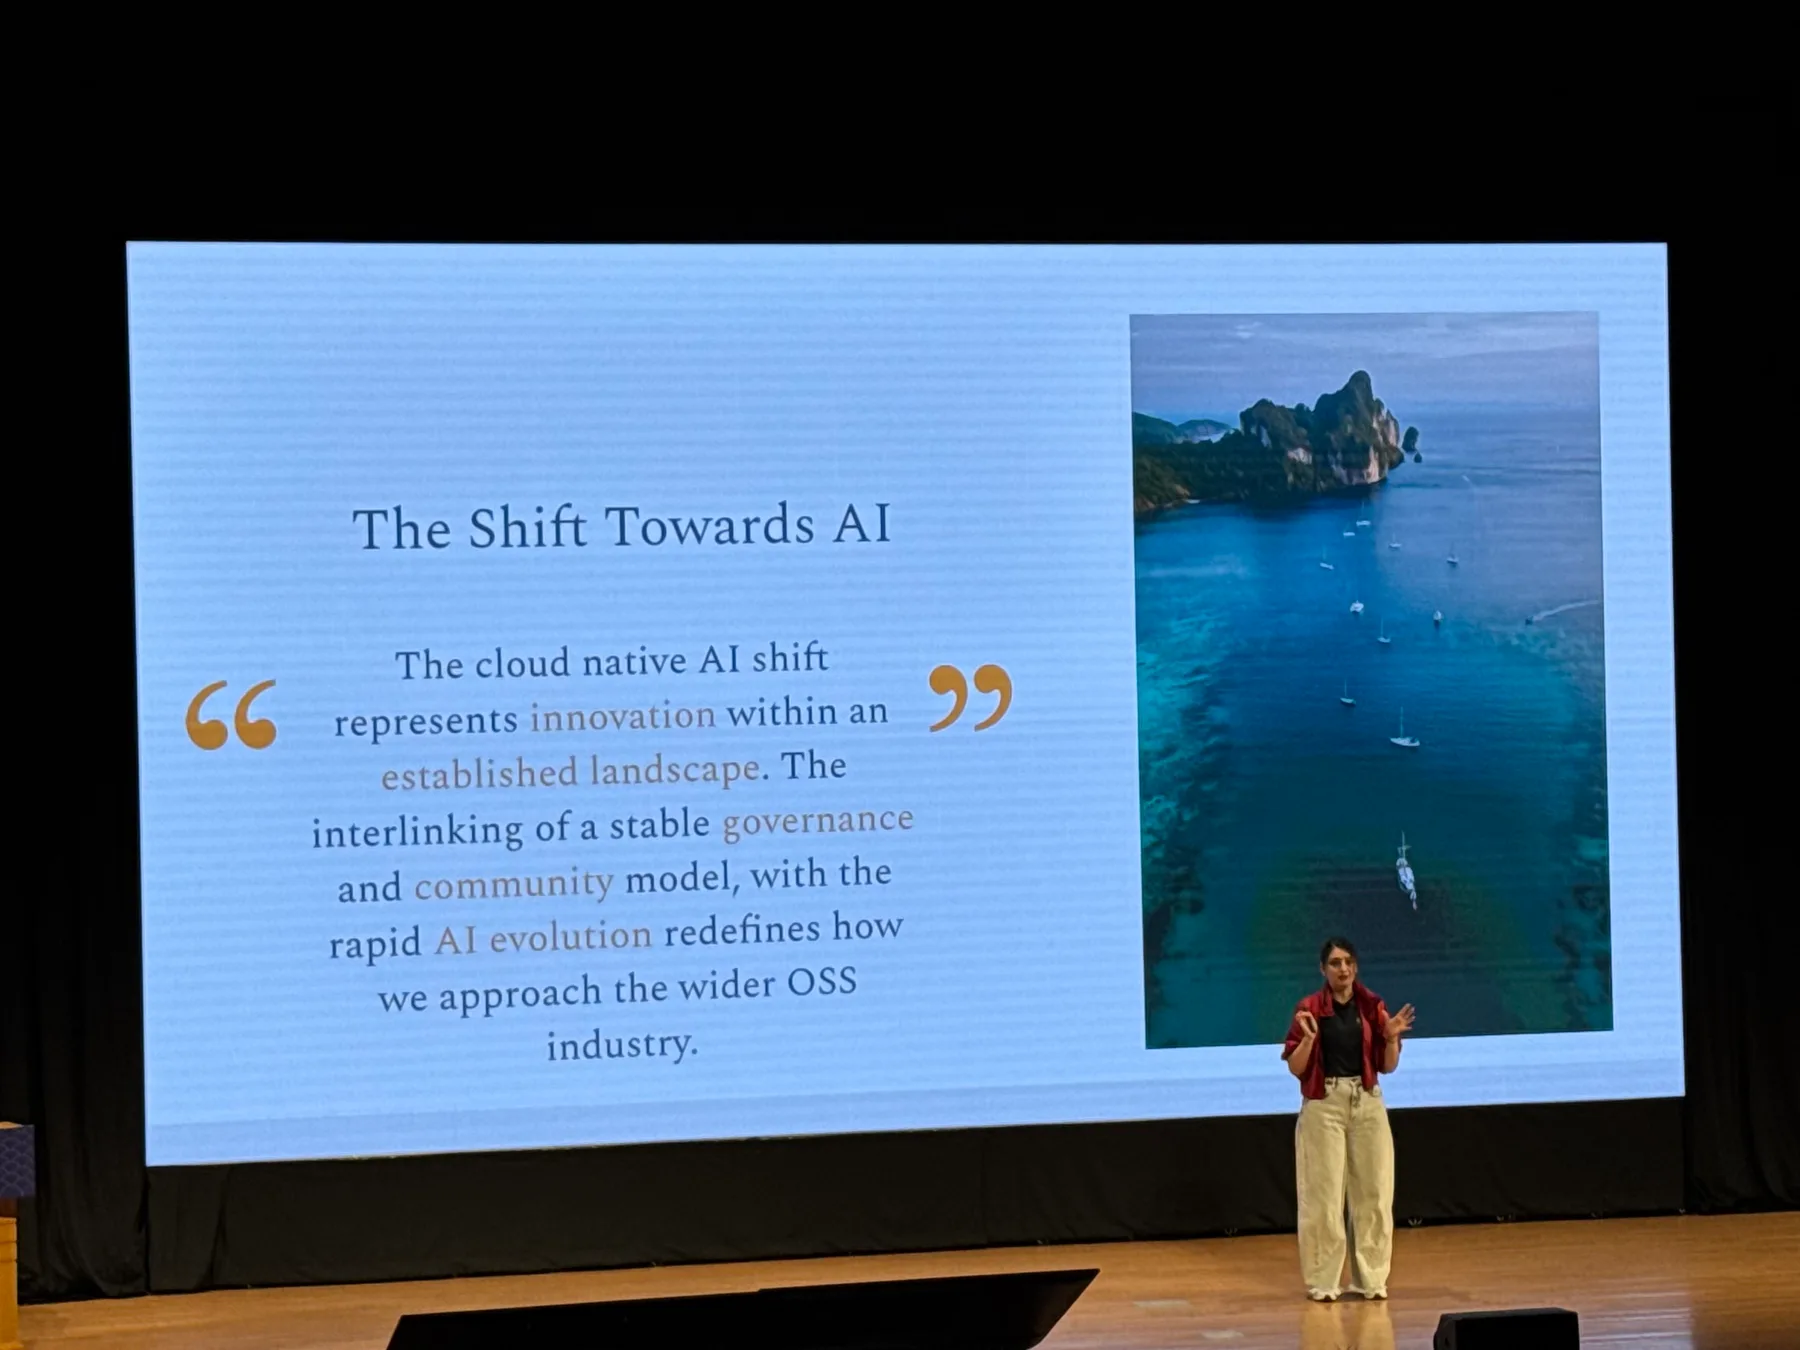
Katie Gamanji, Principal Engineer at Apple, put the same shift a different way: "innovation within an established landscape." What carries over isn't only the design patterns, she argued, but open governance, vendor neutrality, and the way the community operates — the foundation for sustaining open source AI.
The numbers came from the CNCF Annual Cloud Native Survey (2025 edition, published January 2026). 98% of organizations have adopted cloud native, 66% of those hosting generative AI run some or all of their inference on Kubernetes, and 7% of organizations deploy models daily. Most organizations consume rather than build or train AI models, and those that do train them are more likely to fine-tune existing models than start from scratch. AI workloads haven't reached the continuous delivery bar that cloud native set for applications.
She also brought up the CNCF Tech Radar, where more than 300 cloud native developers scored tools on maturity and usefulness. Those scores sort each tool into ADOPT, TRIAL, ASSESS, or HOLD across three areas: AI inference, ML orchestration, and agents. Only MCP and Llama Stack made ADOPT in the agents category — the highest of the four recommendation tiers. I'd like to see that list get longer.
This was my first time hearing an Apple engineer speak live. The delivery, the pauses, the way the slides were staged: all of it felt distinctly Apple. It pulled me in, and the 30 minutes went by fast.
Proxyless gRPC
Pluggable Interception: Using ExtAuthz and ExtProc in gRPC using xDS
A proxyless service mesh drops the sidecar. Instead of routing through an Envoy proxy, the gRPC library itself interprets xDS — the family of APIs a control plane uses to push routing and filter configuration out to the data plane. One less hop means lower latency and lower resource usage. Pawan Bhardwaj, Senior Software Engineer at Google and a gRPC maintainer, presented the work to bring new filters into that setup.
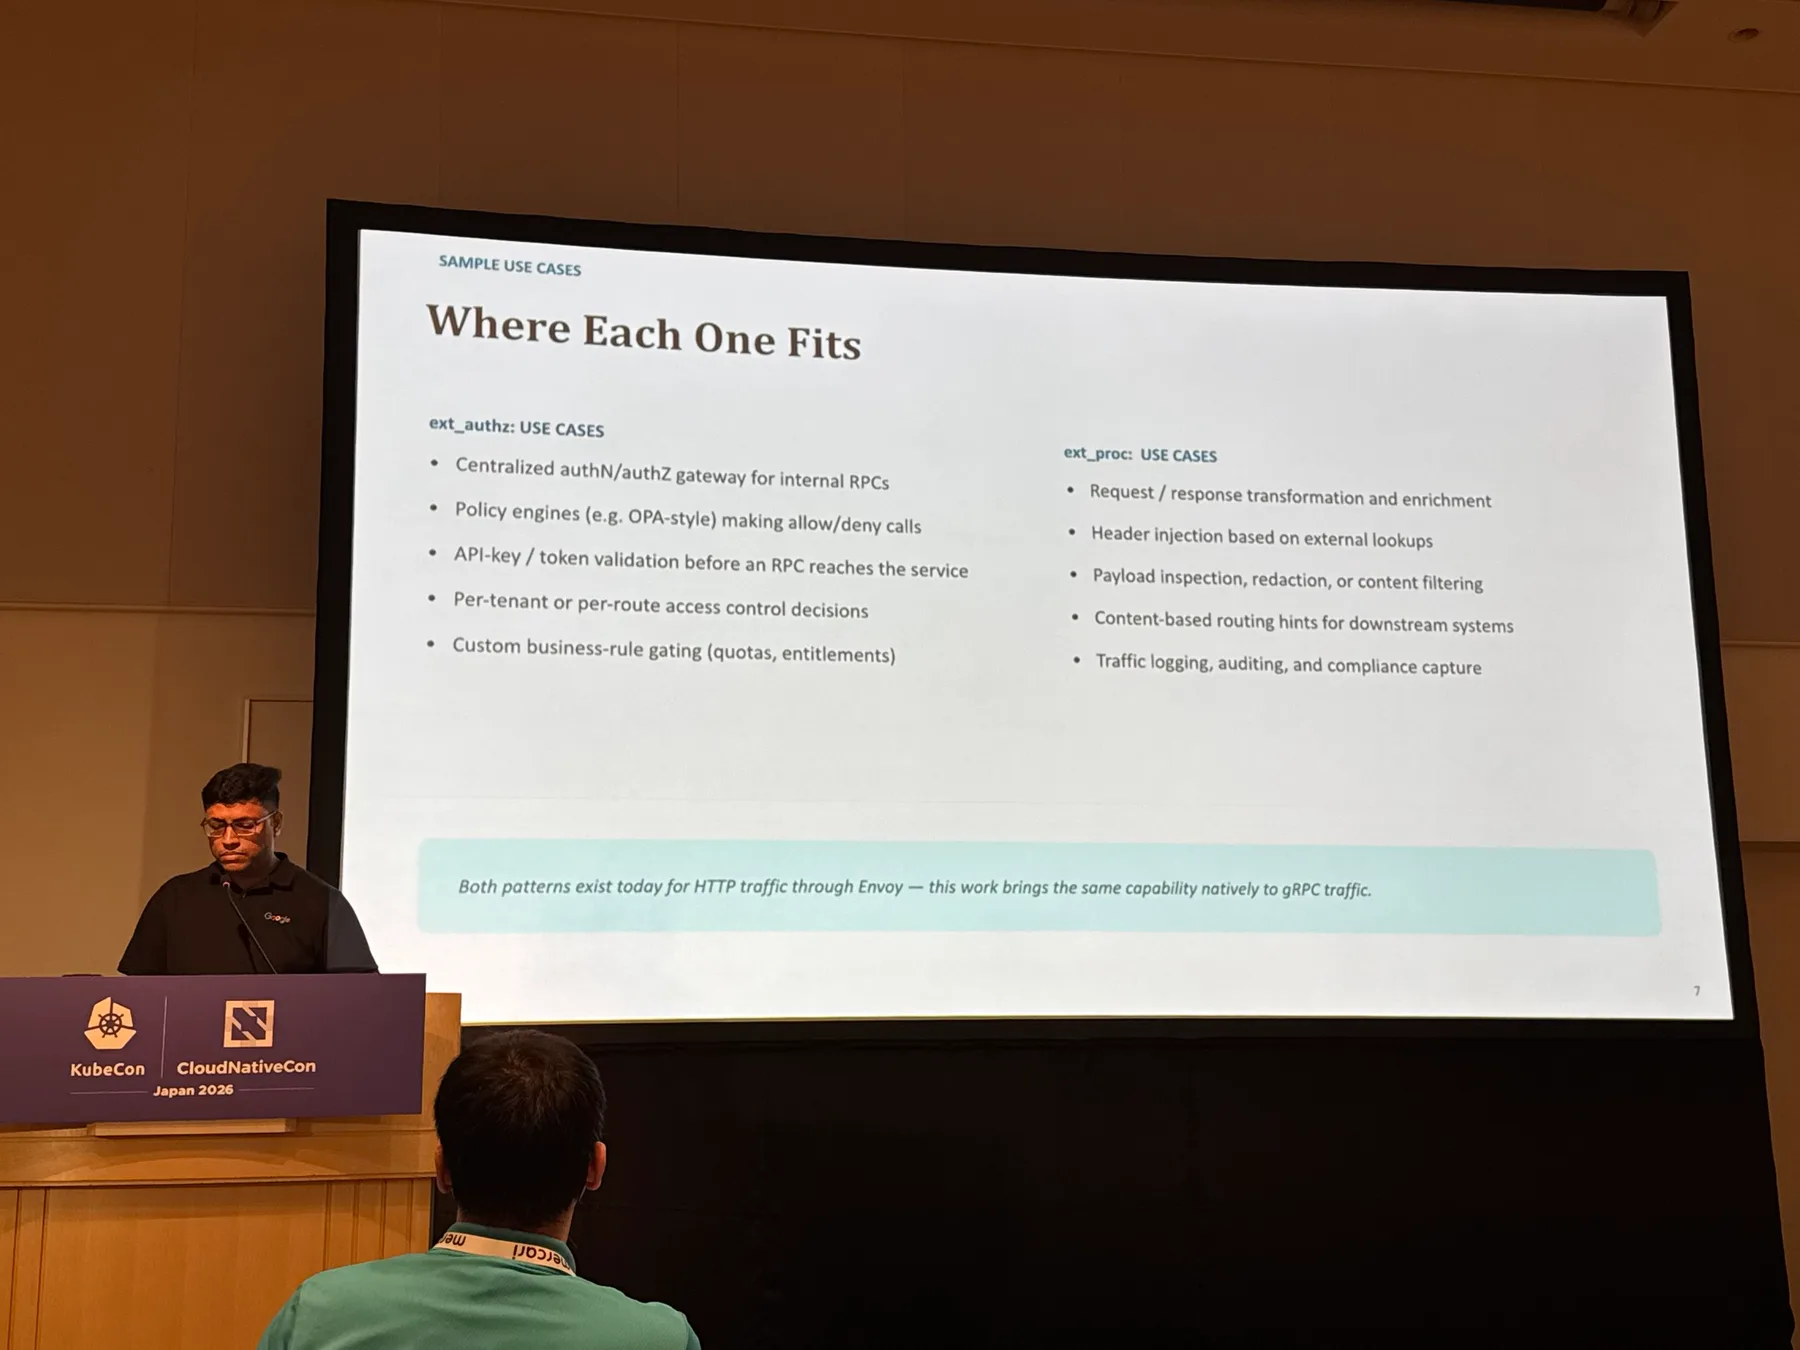
The two proposed additions are ext_authz and ext_proc, both long-standing Envoy HTTP filters being brought into gRPC's proxyless xDS stack. At the start of an RPC, ext_authz makes a single allow-or-deny decision from metadata such as headers and the path, without sending the message body. It runs on the client side as well, so a request can be stopped before it reaches the server. ext_proc streams headers and message bodies out to an external service that can inspect them, rewrite them, or terminate the RPC outright. For AI and LLM gateways, the talk showed API key and token validation ahead of the model backend, and PII redaction on requests and responses as they move through the stream.
Of the four gRFCs referenced in the slides, only Composite Filter (A103) had been merged into the gRPC proposal repository as of July 30, 2026; ExtAuthz (A92), ExtProc (A93), and GrpcService (A102) were still open pull requests. Even the A103 implementation is experimental and guarded by an environment variable.
ext_authz costs one round trip per RPC; ext_proc holds a stream per RPC and keeps going back and forth over it. Latency and availability become design questions the moment you adopt either one. You can contain the latency by narrowing the scope with a Composite Filter that matches on RPC attributes. For ext_authz, failure_mode_allow lets RPCs through when the authorization service is down — the identically named setting on ext_proc applies only in observability mode or before the message is sent. External calls inherit the trace context of the original RPC, so they show up as child spans, and the metrics cover allow, deny, and failure counts for ext_authz plus wait time for ext_proc.
I use gRPC day to day, so this one sat near the top of my list. Authorization and masking tend to scatter across services, and moving them into external services that xDS configuration can swap out is an appealing way to handle that.
Observability
From Statsd to OpenTelemetry: Atlassian's Metrics Platform Migration at Scale
Atlassian's StatsD platform spanned 14 regions and roughly 100,000 hosts. Principal Software Engineer Iris Grace Endozo and Senior Software Engineer Farzad Vazirnia walked through moving all of it onto the OpenTelemetry Collector. The gostatsd deployment they had been running was stable enough; it just couldn't receive OTLP, and chasing Collector-equivalent optimizations on the gostatsd side had turned into real maintenance work.
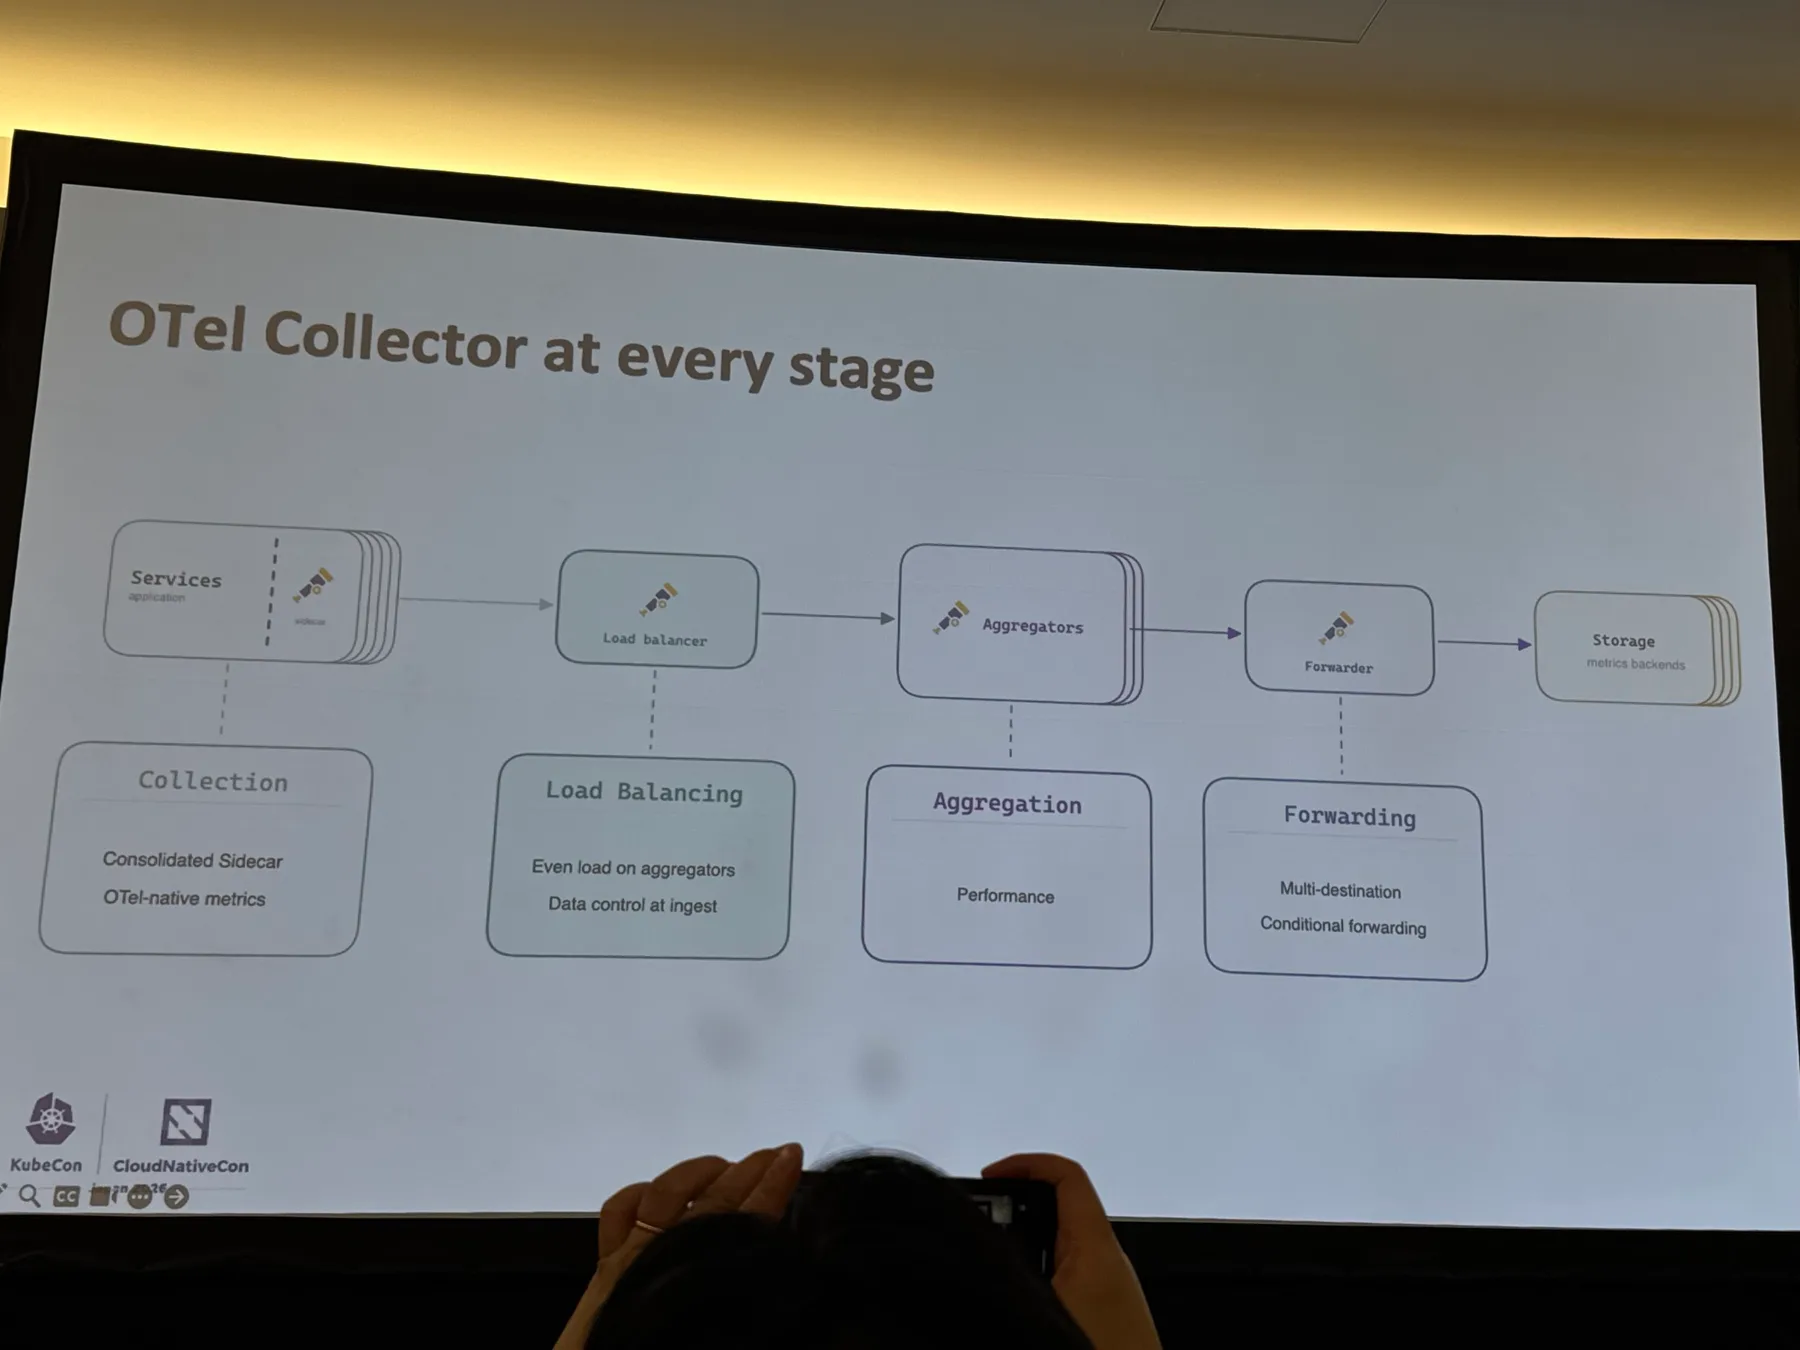
Applications went untouched. On every host, the StatsD sidecar gave way to a Collector that receives both StatsD over UDP and OTLP. They build the Collector once per role, so collection, ingestion, aggregation, and forwarding each run as a separate binary. The aggregation stage folds every data point from a given time series into one point per 60 seconds, taking roughly 4.8 billion data points a minute down to about 230 million. Sharding needed rethinking too: when points from the same series land on different servers, the total splits apart, and the original scheme keyed on service name and environment. Traffic varies enormously per service, so per-server intake ran anywhere from 50,000 to 600,000 points per second. Keying on streamID, the identity of the series itself, evened that out to about 220,000. As aggregation moved off gostatsd and onto the Collector, CPU across the aggregation fleet fell from 2,200 cores to 1,500. Rollout began in lower environments with non-critical services, and since the old and new platforms coexist for a long stretch, they kept operational procedures identical on both sides.
Their first priority was to avoid changing what the metrics mean to the people reading them. A platform swap pulls attention toward what the new tool can do, but what decided whether this migration could go ahead was whether existing alerts and dashboards still returned the same values. That's the harder question, and the one I'd want to answer first.
Designing for High-cardinality Metrics
Reddit runs thousands of pods, and a single dashboard query can end up reading an enormous number of time series. Walther Lee (Software Engineer) and Aleksandr Krivoshchekov (Staff Software Engineer) walked through their fix: build Deployment-level aggregates at ingestion time, and keep them apart from the per-pod series they need during an incident.
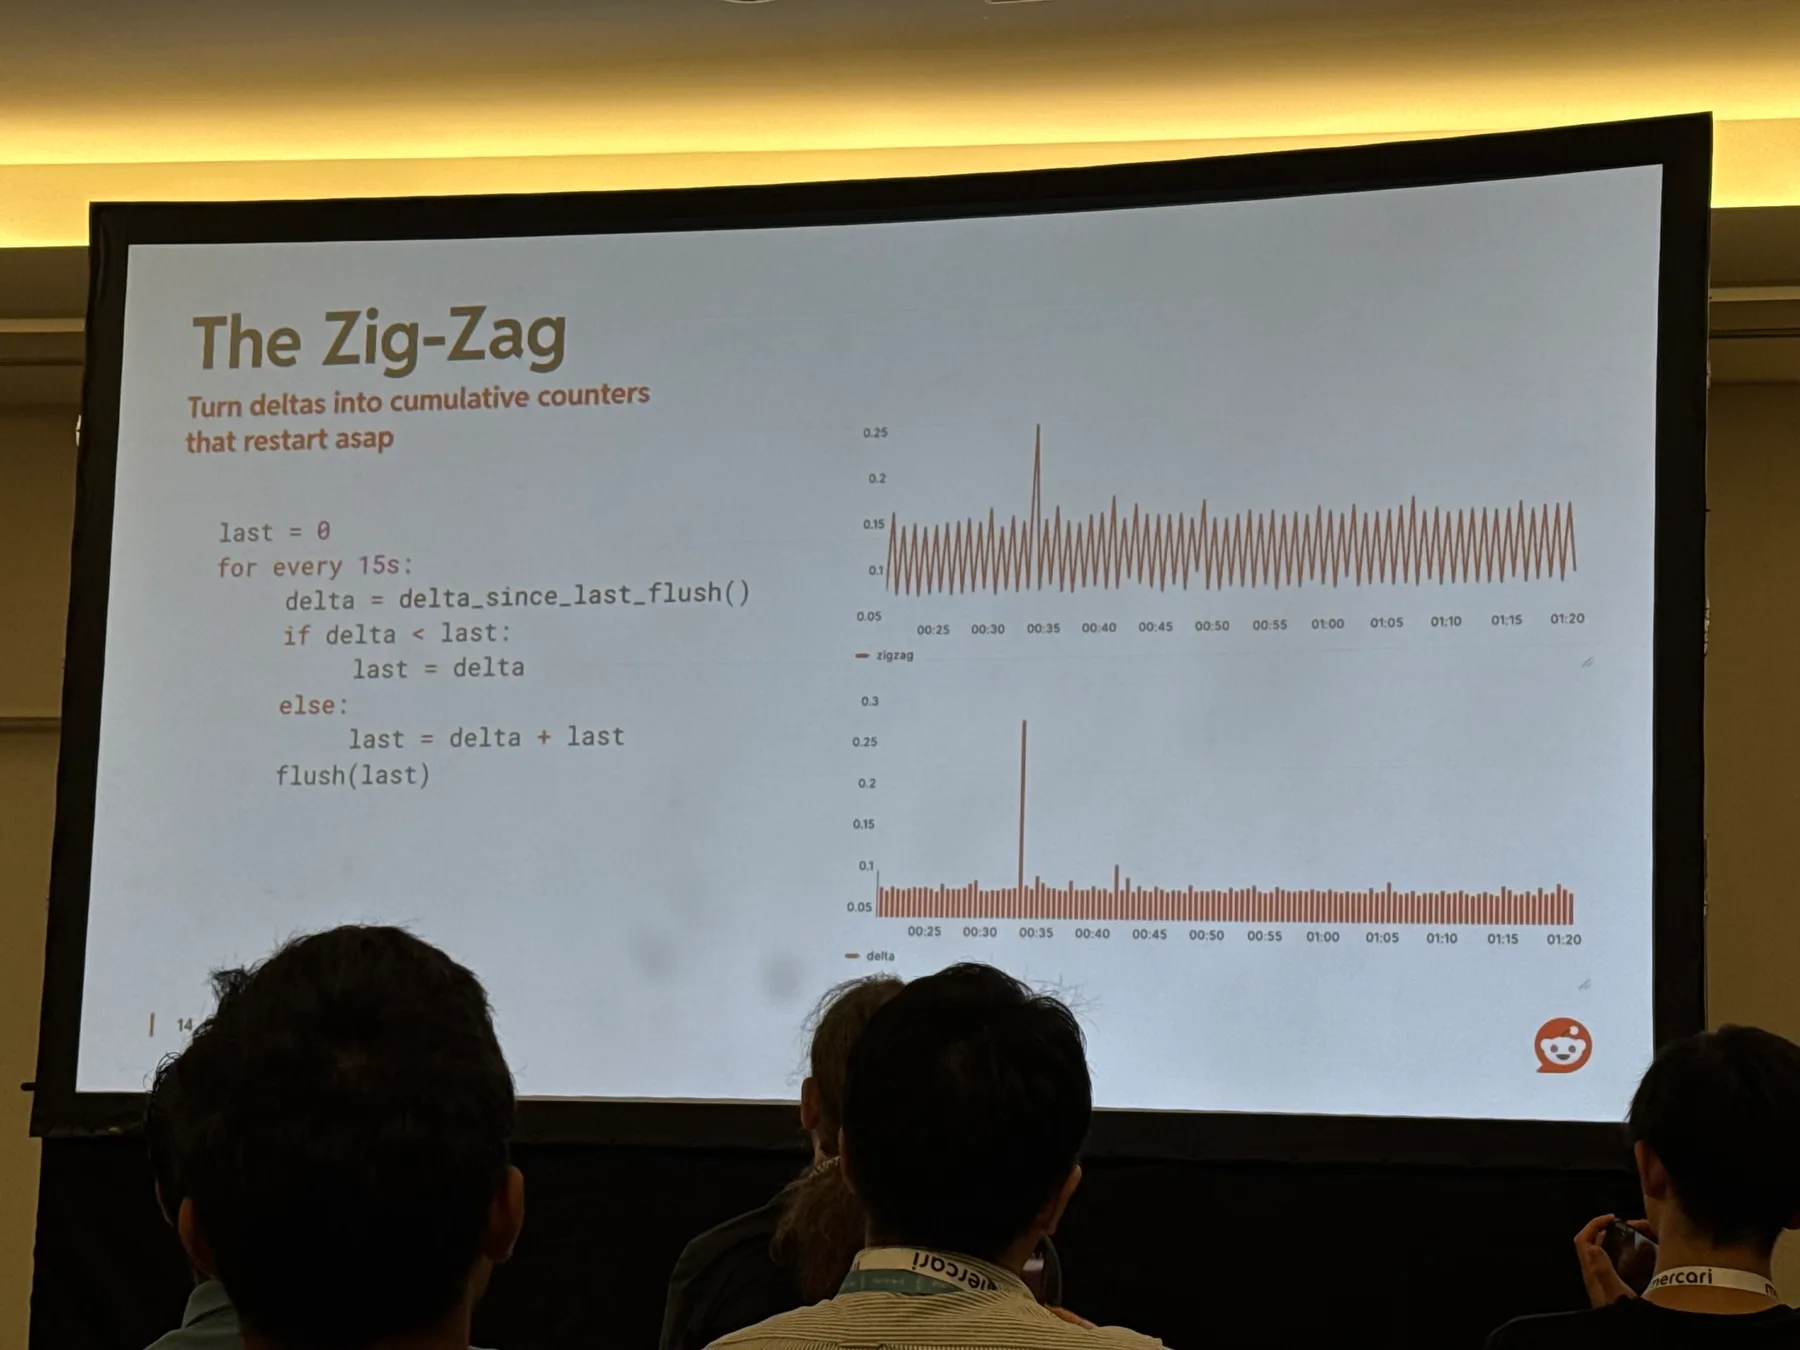
Cumulative counters on a pod reset when the pod restarts, so you can't simply add them up. Their approach converts to deltas at scrape time, aggregates, and converts back to cumulative form. The window where a series stays cumulative shrinks to roughly the scrape interval, and the counter resets the moment the aggregate is written, so the series climbs and drops over and over — a zigzag counter, as they call it. Prometheus reads each drop as a counter reset, so rate and increase still return the correct deltas. This covers counters, plus classic histograms, whose buckets are cumulative counters underneath. In their evaluation, the number of series a query reads fell 88%, latency fell 80%, and the average deviation from the raw data came to 0.15%. The presenters walk through the algorithm in Materialized metrics in Prometheus.
I like fixes shaped like this one. Shrink the cumulative window to the scrape interval, let the counter zigzag, and correctness falls out of behavior Prometheus already has.
One Binary, Two Ecosystems: Embedding Prometheus Exporters with OCB
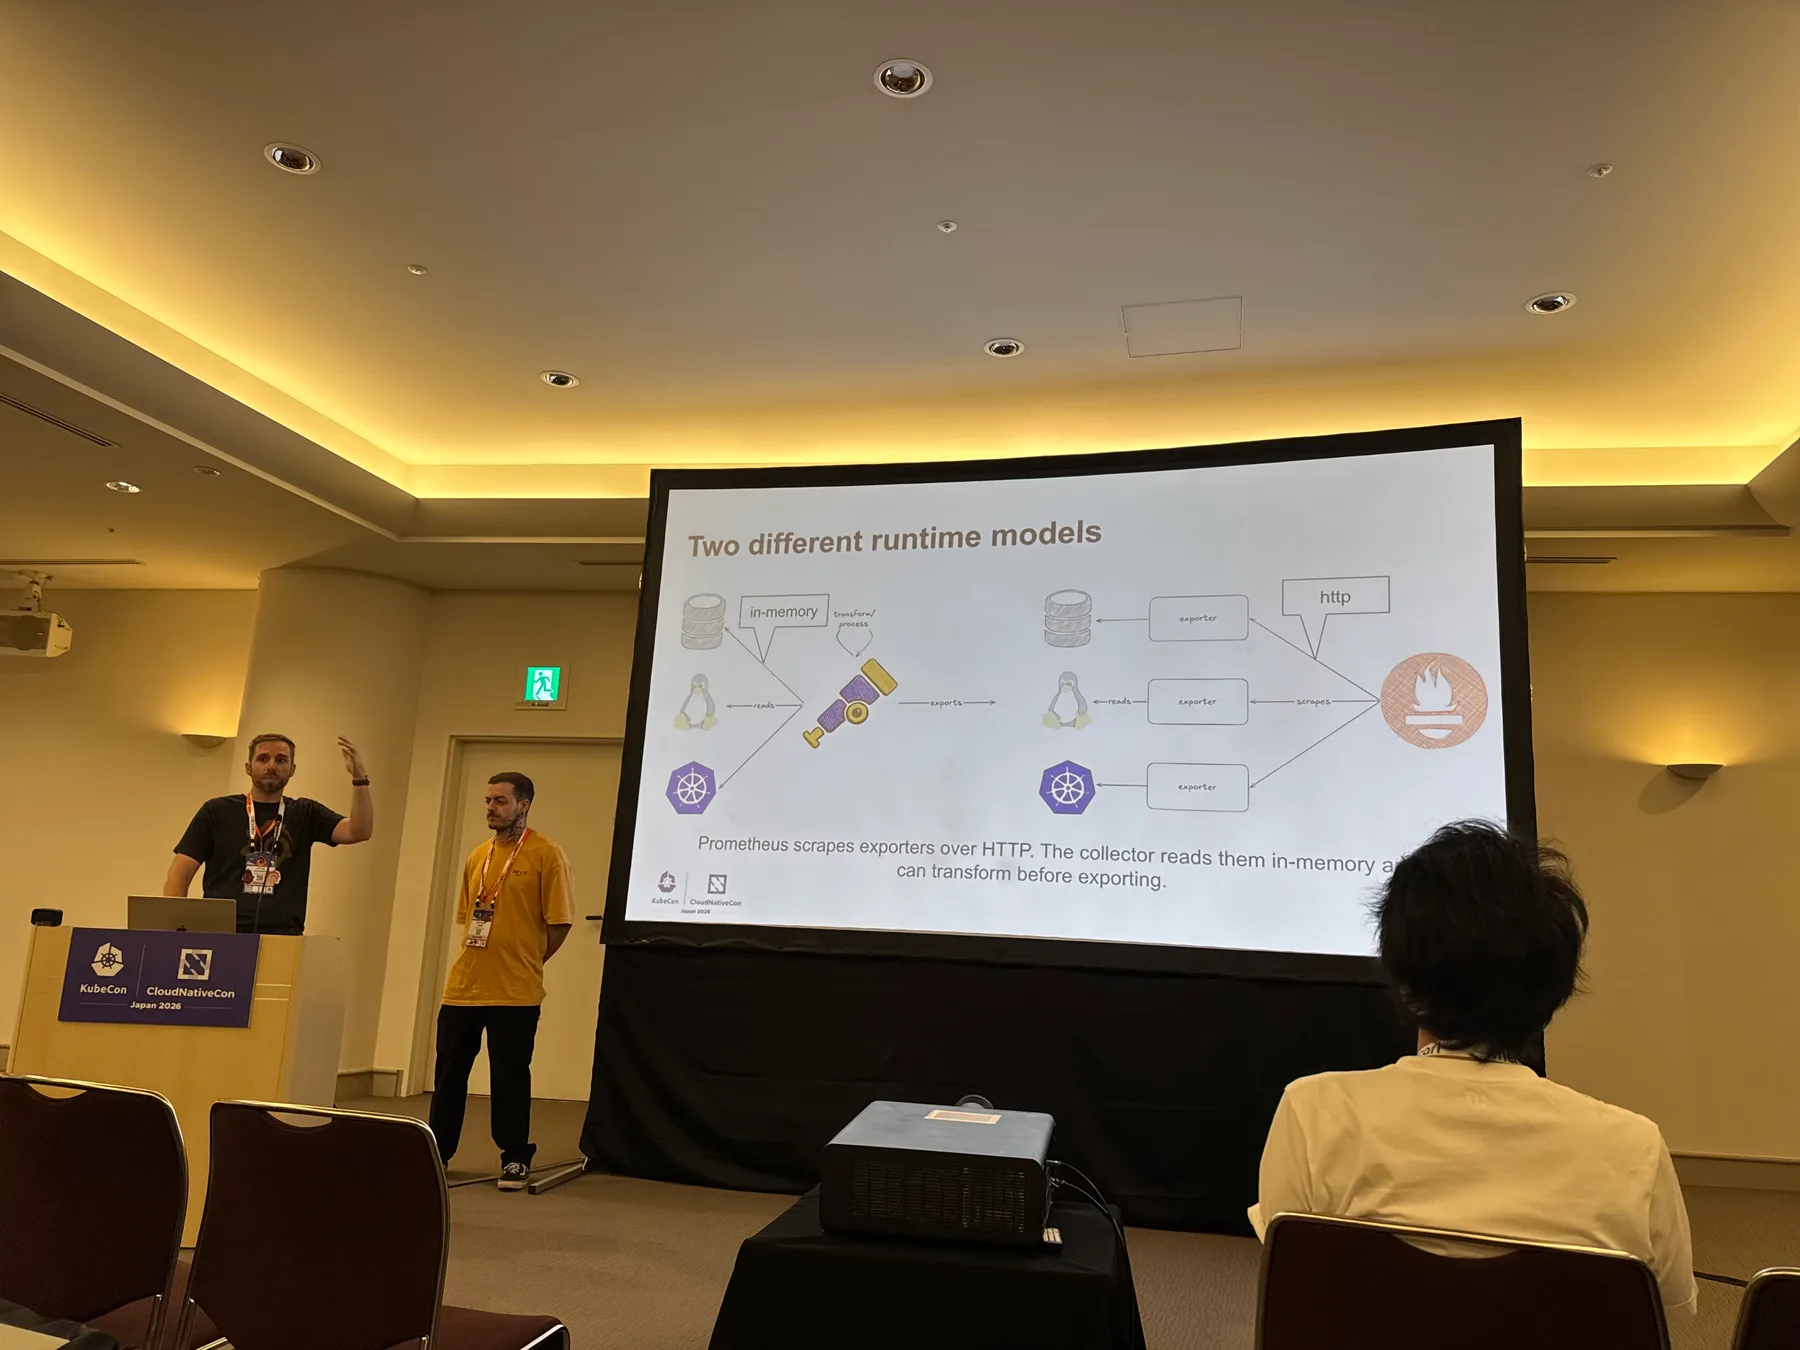
opentelemetry-collector-bridge takes a Prometheus exporter and runs it as an OpenTelemetry Collector receiver. Kyle Eckhart (Principal Software Engineer) and Arthur Sens (Software Engineer) of Grafana Labs showed how it works: the exporter comes in as a library and runs inside the Collector process, with no HTTP endpoint exposed. The Bridge receiver drives the scrape loop within the Collector, reads in memory, and converts to OTel format. That puts a proven implementation on a new pipeline without rewriting an equivalent OTel receiver from scratch, and OCB (OpenTelemetry Collector Builder) selects only the components you need and builds them into a single binary.
One binary doesn't settle the naming, though. node_cpu_seconds_total and system.cpu.time carry the same information, and treating them that way takes a conversion — one that users write by hand in OTTL today, one at a time. The plan is to ship those conversions with the Bridge so nobody has to write them, and beyond that, to hold the correspondences in a schema while leaving metric names alone, so schema-aware PromQL matches a query under either name. Both the Bridge and the Prometheus Collector distribution that bundles Bridge-based receivers were marked [EXPERIMENTAL] as of July 30, 2026.
A migration reuses more than implementations. The meaning that existing dashboards and alerts depend on has to survive the move as well. And the single binary wasn't really the point — refusing to maintain the same knowledge twice, once per ecosystem, was.
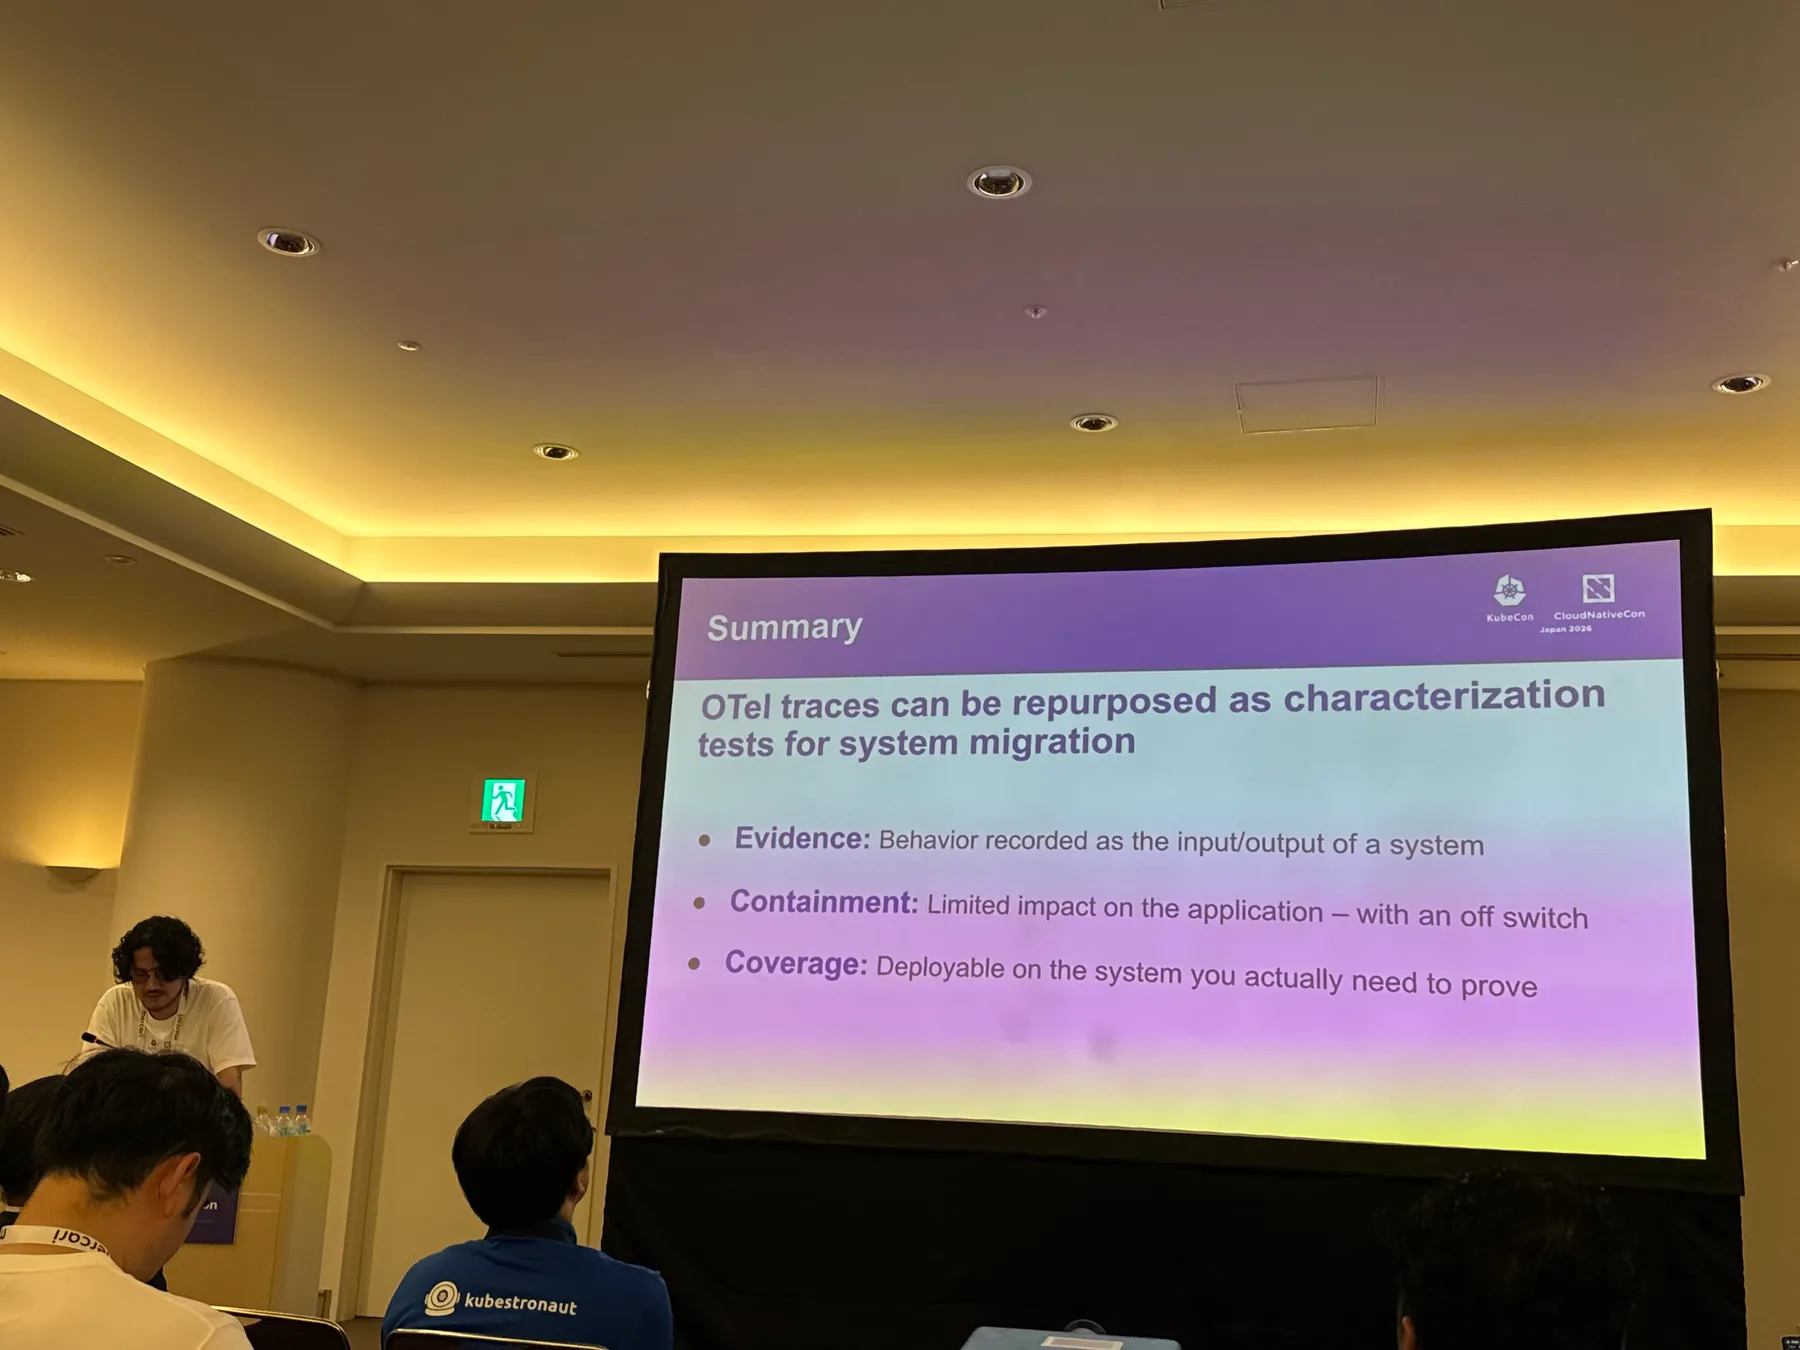
Repurposing OpenTelemetry Traces as Test Data: Breaking the Cost Barrier in System Migration
The spec is gone and the code has no tests, so what do you compare against after a migration? Platform Engineer Yoshiki Fujikane of CyberAgent, Inc. answers with traces from the system already running. Record requests and responses in spans, replay the same requests against the migration target, compare the results, and you have characterization tests without reconstructing lost specifications or reading through untested code.
Traces as captured won't do the job. HTTP request and response bodies fall outside the OpenTelemetry Semantic Conventions today, and the standard Go HTTP instrumentation used in the PoC did not record them. The PoC added bodies as custom attributes, but attaching a body to every request costs latency and inflates trace volume, and with a SaaS trace backend, sensitive data leaves your systems entirely. So they gated the recorded routes behind a feature flag and had the Collector route traces carrying bodies to local files. Where instrumenting the application itself is impractical, the talk covered capturing bodies with the eBPF-based OBI (OpenTelemetry eBPF Instrumentation) instead, without changing application code.
Piling up telemetry earns nothing on its own. It turns into something else — test data, in this case — only once you've designed it to be reused safely. That's observability taken further than I'd thought to take it.
From Tool Calls to Context Fabric: Building AI-Native Observability for Platform Engineering
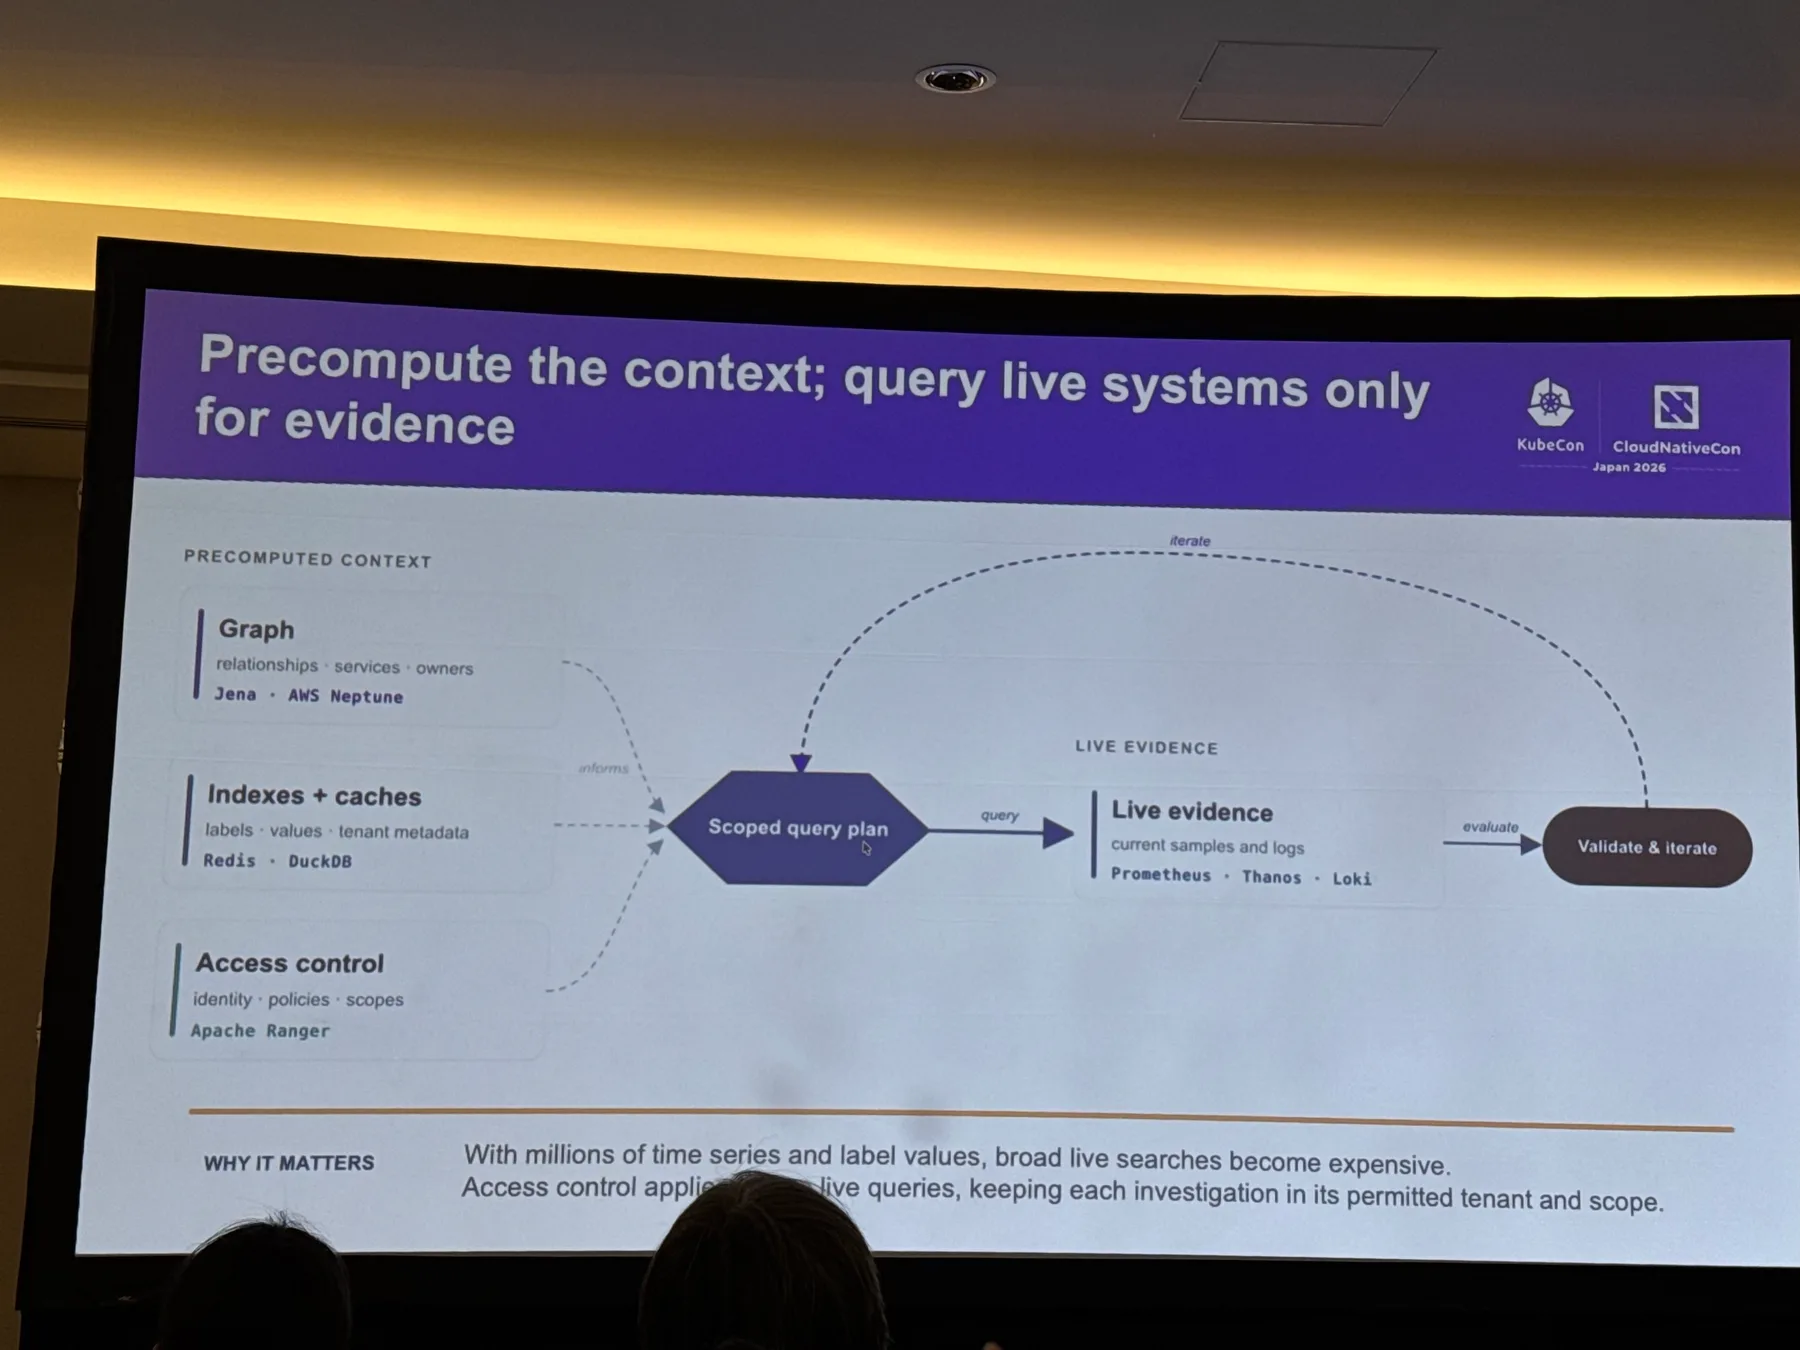
An alert fires on rising latency in the Thanos Store API. Three candidate causes line up, and not one has evidence behind it. That's where Deepak Choudhary, Senior Systems Software Engineer at NVIDIA, began his case for Context Fabric: prepare the context an investigation rests on before you hand it to an AI agent.
Tools for querying metrics and logs won't get you there. Partway through the demo the agent stalls, unable to pick out the right metric. There are 128 metrics with "store" in the name, and even the closest match shows a p95 of 0.095 seconds against the 47 seconds in the alert. So the scope gets pinned down first — component, dependency, operation, time window — and candidate metric names and labels come from a graph built in advance. That graph comes from scanning TSDB blocks in object storage once an hour, which keeps high-cardinality scans out of investigation time. Three MCP (Model Context Protocol) endpoints serve as the way in — Metrics, Logs, and Skill — with the Skill MCP returning investigation procedures drawn from approved runbooks. MCP unifies the interface while authorization lives inside each MCP, ahead of any live query. Later in the demo, metrics and logs agree on the same time window and the agent still stops, calling the cause unproven and asking for approval of what to examine next. Even with approval it never touches the system itself, and the output says as much outright: no change is authorized by this investigation.
None of this works unless people build the scaffolding first: what the AI can reach, the order it investigates in, the guardrails around anything that changes state. AIOps that holds up in production starts with that design work, done up front.
Designing evaluation before delegating to AI
Three sessions covered handing judgment and work over to AI agents. None of these teams took the AI's output at face value — each one confirmed it with something outside the AI: a threshold, an aggregate, a test.
AIOps: (near) Zero-Touch Production Rollout Fixes
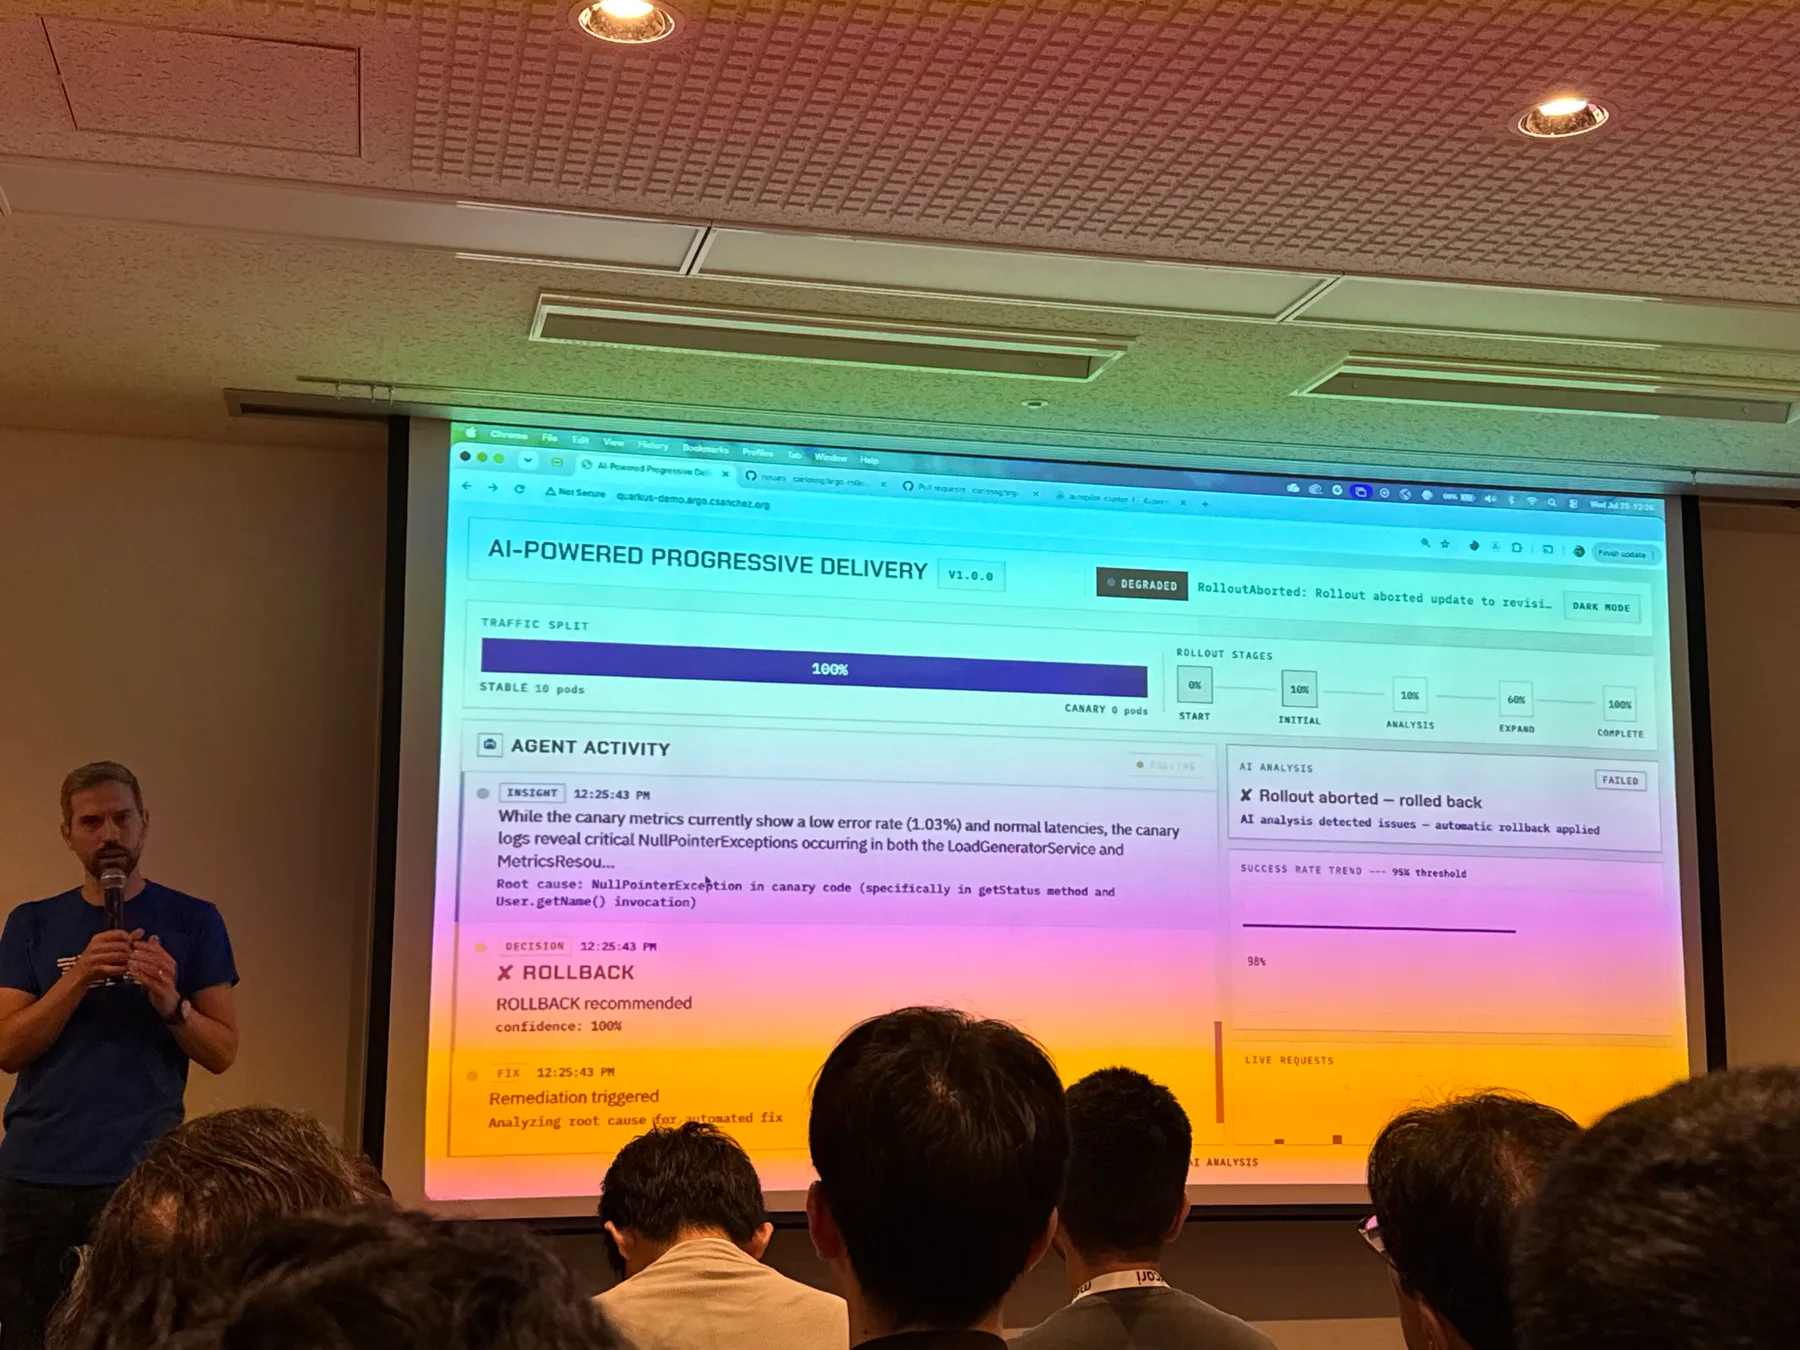
A canary release raises traffic to the new version in stages, checking at each step whether to keep going or roll back. Writing the conditions for that check has traditionally meant PromQL, one metric at a time. Kevin Dubois (Senior Principal Developer Advocate, IBM) and Carlos Sanchez (Principal Scientist, Adobe) presented a setup that hands the verdict to an AI agent instead.
The pass/fail conditions live in an AnalysisTemplate. Put a metric plugin (rollouts-plugin-metric-ai) there in place of PromQL, and at analysis time the plugin calls out to an external AI agent. The agent works through metrics, logs, and pod information in parallel, then returns a score with its reasoning, and Argo Rollouts checks that score against a condition like successCondition: result > 0.50. Investigation and scoring are the AI's job; the line between pass and fail stays where a human put it in configuration. In the demo the canary showed a 1.03% error rate and normal latency, but the agent found a NullPointerException in the logs, returned ROLLBACK, and the rollout reverted to the prior state. Remediation follows asynchronously — a pull request if a simple code fix covers it, a detailed issue if it doesn't.
A rollback lands you in a known prior state even when the call is wrong. A fix that misses has no defined landing point at all. Drawing the line by where you end up when the agent is wrong, rather than by how accurate it is — that's a framing I want to keep when deciding how far to automate.
From Experiment to Enterprise: Scaling an AI Agent for Code Review
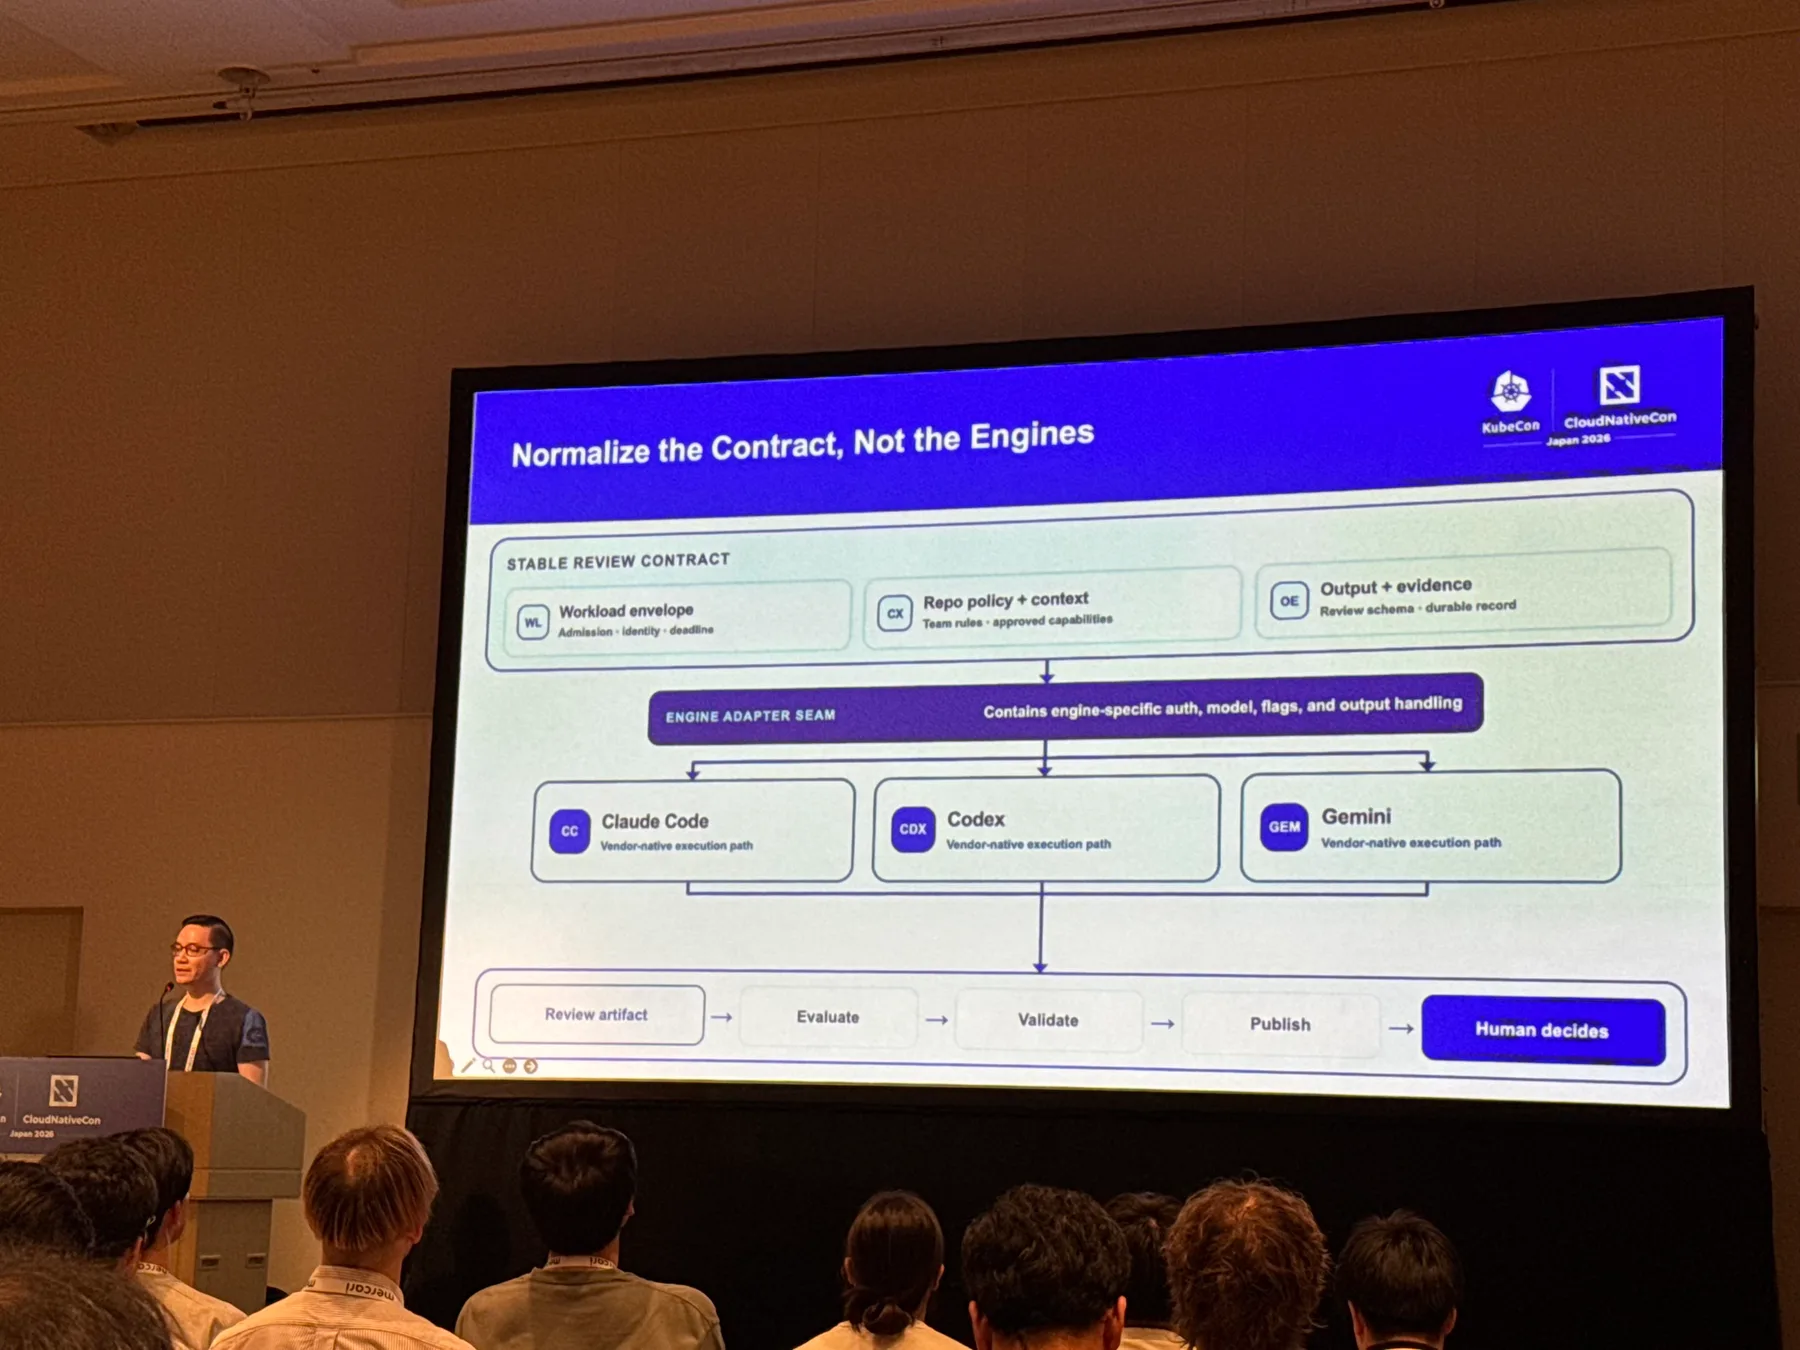
More than 400 PlayStation repositories run an AI code review agent. Adam Phan, Staff Software Engineer at Sony Interactive Entertainment, described how it got there. The hard part was never making an agent review code — it was operating one as a shared company-wide service while earning and holding onto trust. So a single review became a job with limits on input, output, and runtime. The agent reads the pull request diff and whatever context it's permitted to reference, uses only the tools it's allowed to use, and returns findings with supporting reasoning — nothing beyond that. Accepting a finding and merging the change stay with the engineer.
The execution environment spins up a Kubernetes pod per review and throws it away when the review finishes. The information inside disappears with the pod, so the terminal state and whatever was shown to the engineer get written out before disposal, leaving a record of whether the run succeeded, failed, or timed out. That record proved its worth in their first production problem. A slight change to how reviews were routed degraded quality, but each individual run looked fine; the anomaly surfaced only in aggregate trends and a cost overrun. They now run a verification step that aggregates results across multiple runs and compares them against the previous release.
That's the detail I keep coming back to: every individual run looked fine, and the aggregate still showed degradation. Any AI agent can fail that way, and spot checks won't catch it.
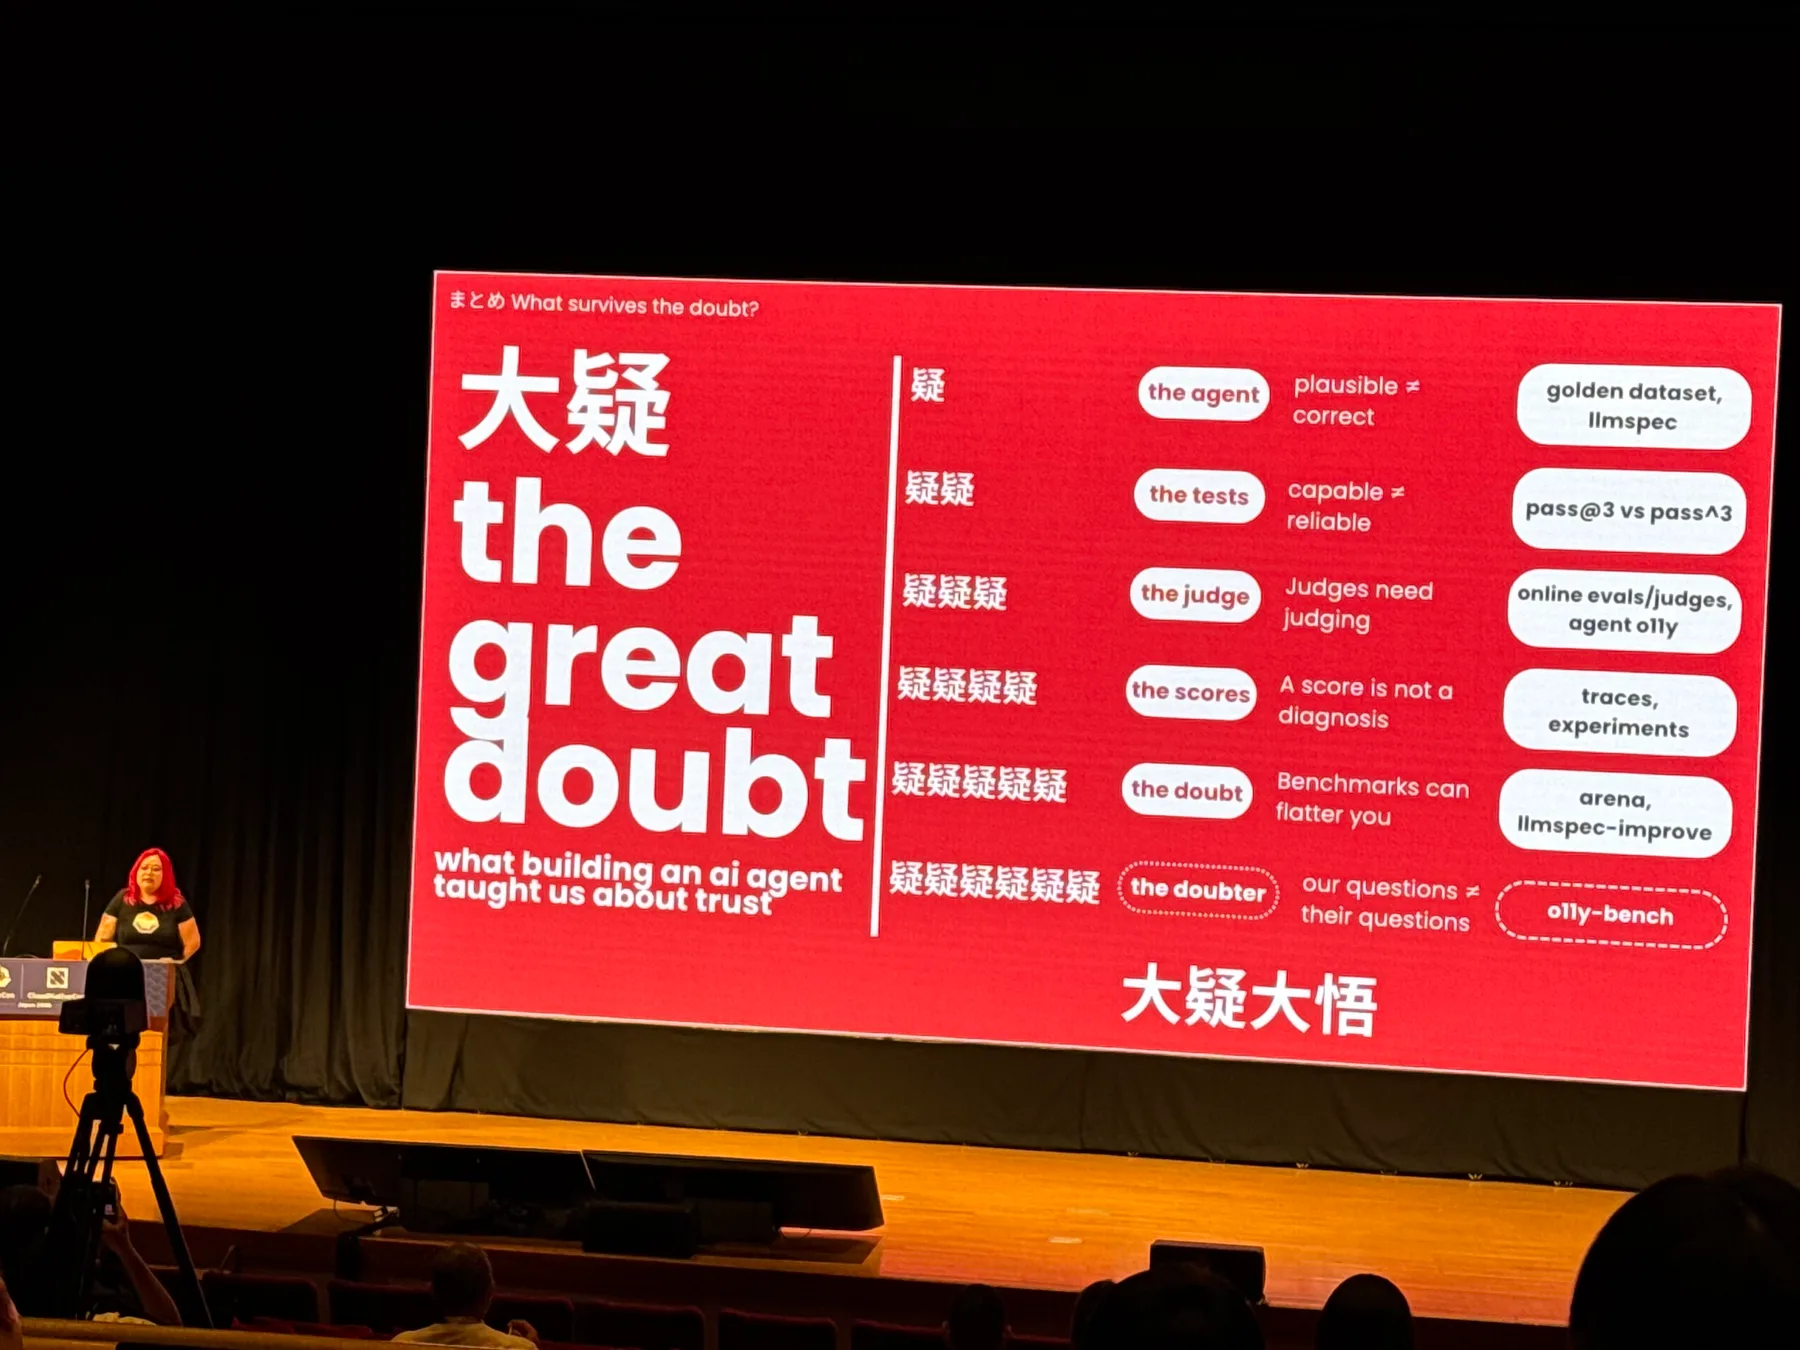
The Great Doubt: What Building an AI Agent Taught Us About Trust
Grafana Assistant returned an analysis that read as though it had consulted Tempo traces — traces it had never received. A bug kept them out of the context, and the answer was plausible enough that human review missed the error. Nicole van der Hoeven, Senior Developer Advocate at Grafana Labs, started there and worked her way deeper into what to doubt: the agent, the tests, the grading model, the scores, and doubt itself. Her frame for all of it was the "Great Doubt" as taught by the philosopher Keiji Nishitani.
Doubt lands first on the Assistant's answers. They built a set of test questions out of real production conversations and made them checkable automatically in an environment where the right answers are known in advance — Prometheus, Loki, and Tempo on Docker. An LLM won't necessarily answer the same question the same way twice, so each test runs three times, with pass@3 (succeeds at least once) measured separately from pass^3 (succeeds all three times). That split tells a fluke from something reliable. Grading went to an LLM as well, and they caught it relaxing its own criteria to award a pass. So they ran offline evals against the question set before release, and paired them with online evals that grade production answers continuously. Even then, benchmarks scored highly in a run where the system prompt never loaded at all.
This one went as far as observing whether the evaluation itself still works, and framed the whole thing through the lens of a Japanese philosopher. I haven't heard a talk quite like it.
Beyond the sessions
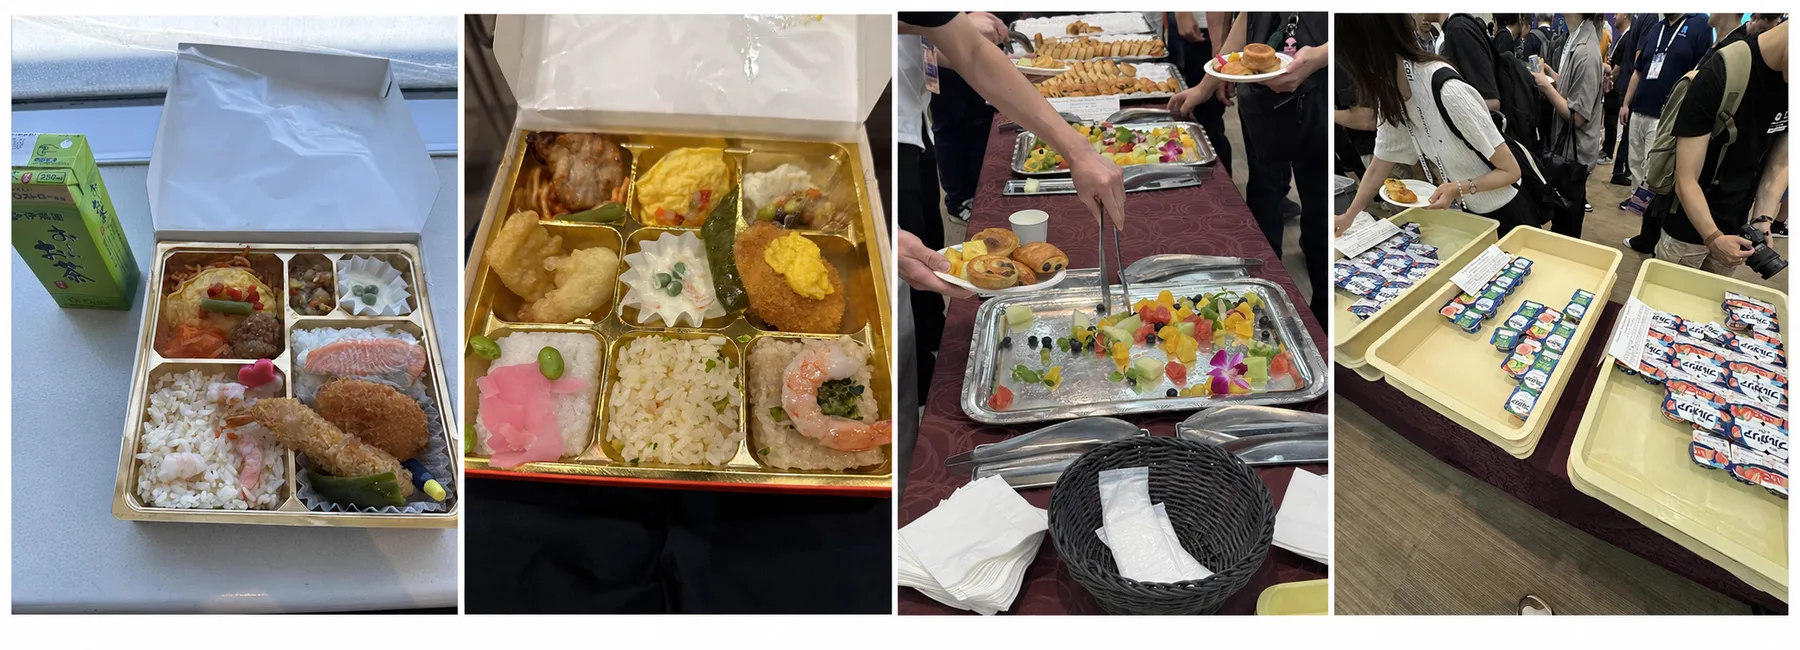
Everything around the sessions was just as good. The welcome reception and the coffee breaks landed at exactly the right moments, and you could see the thought that went into making it easy for people to start talking to each other. Great bento and catering, a drink in hand, technical conversations going on in every corner of the venue — it had all the energy of the bigger KubeCons abroad.
The other classic conference pleasure is booth swag, and the variety was excellent: chopsticks from HashiCorp, a T-shirt from Argo, socks from Datadog. The line for the official conference T-shirt stretched way back, and between sessions the whole place kept buzzing.
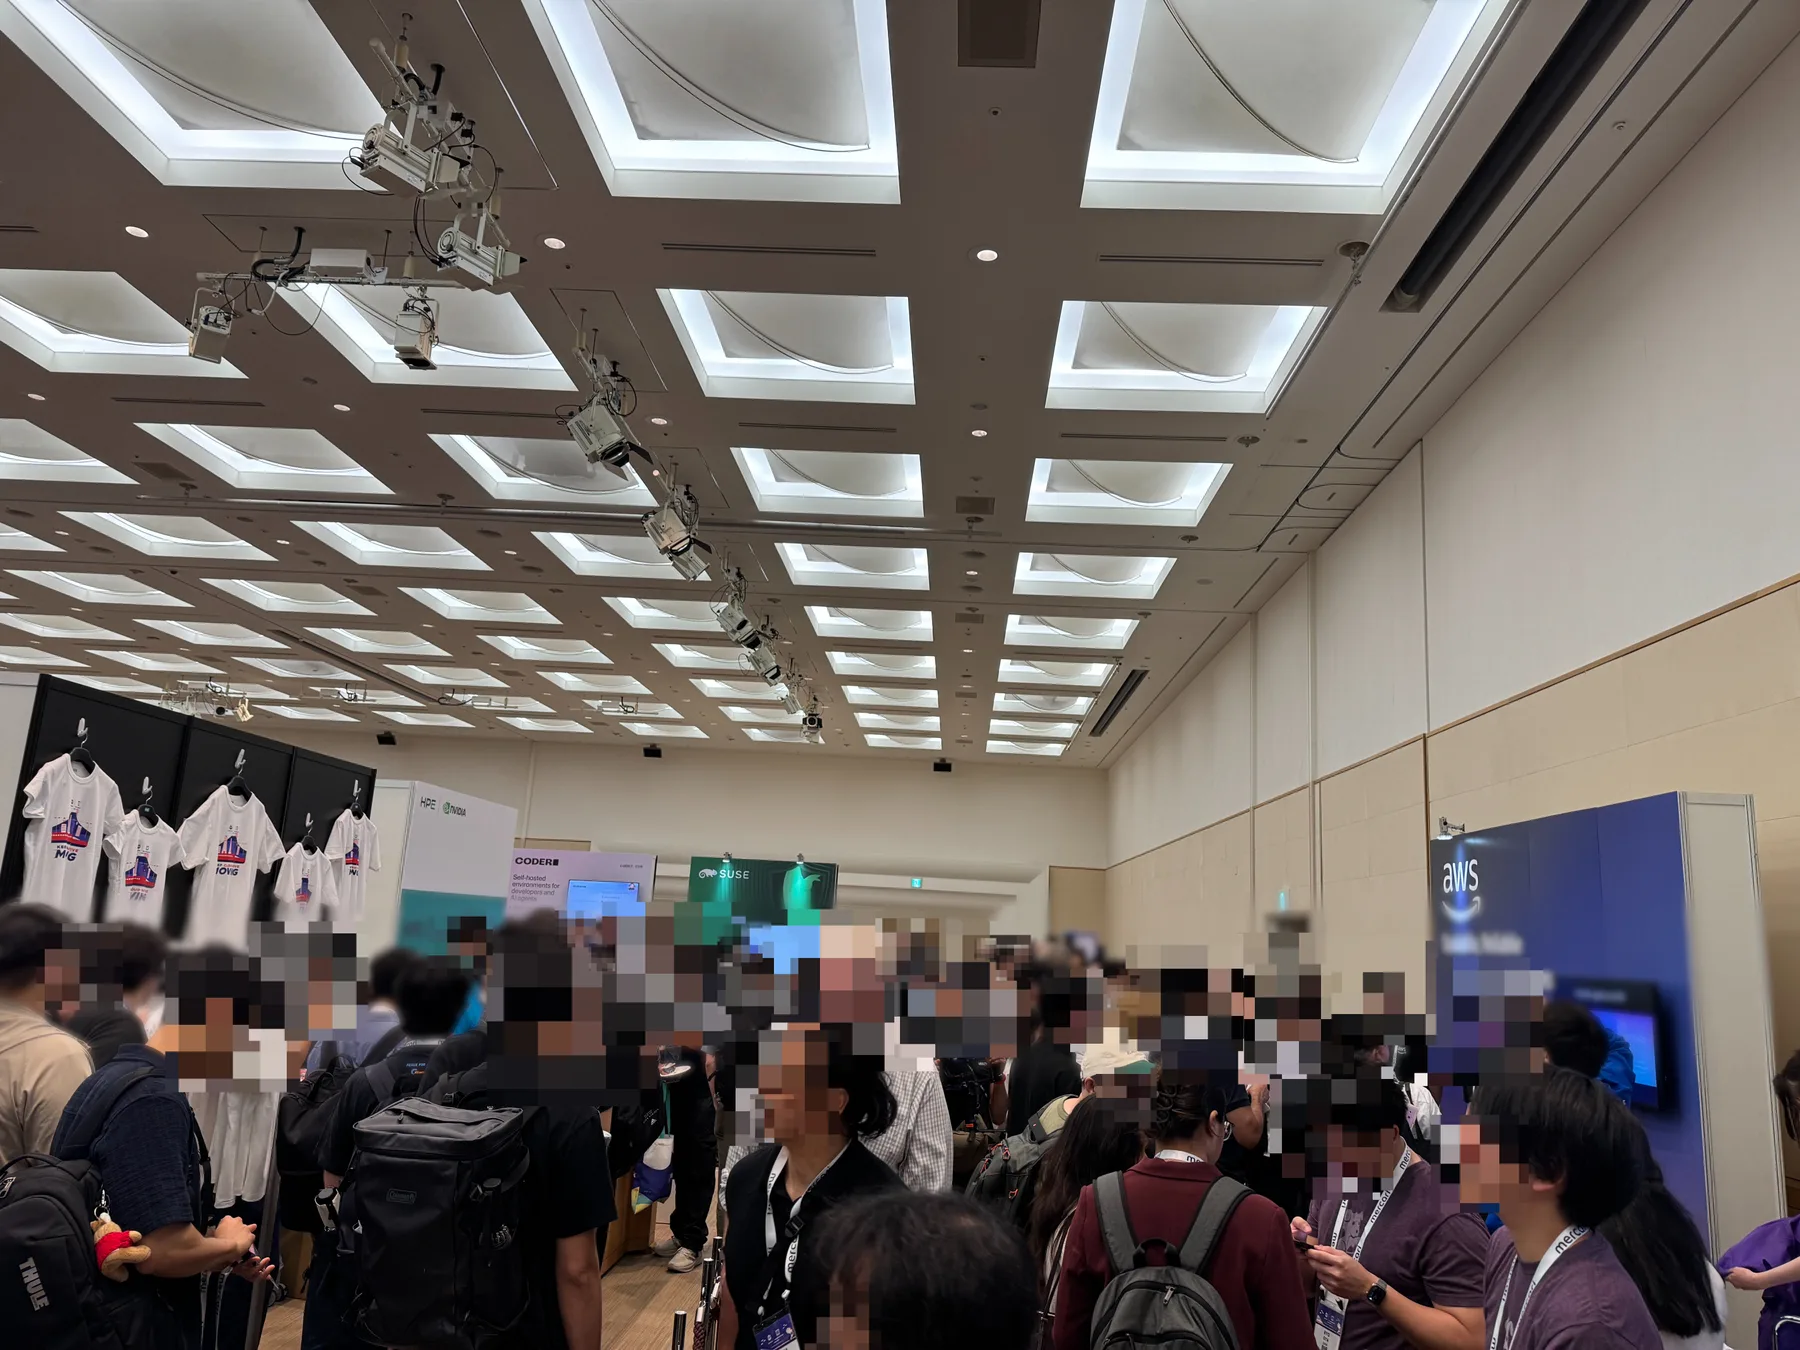
Huge thanks to all the volunteers and organizing staff who created that atmosphere and kept a two-day event of this size running without a hitch!
Looking Back
These two days gave me more than a chance to catch up on technical trends. They left me with a renewed sense of motivation as an engineer.
Being around engineers from all over the world and hearing firsthand how they approach difficult problems helped me see more clearly both what I understand and where my gaps are. More than anything, it reminded me how much I enjoy this field.
I was also glad to hear that KubeCon will return to Japan. I'm already looking forward to it.